See the video and article below to learn more about the Imagery tools available in View.
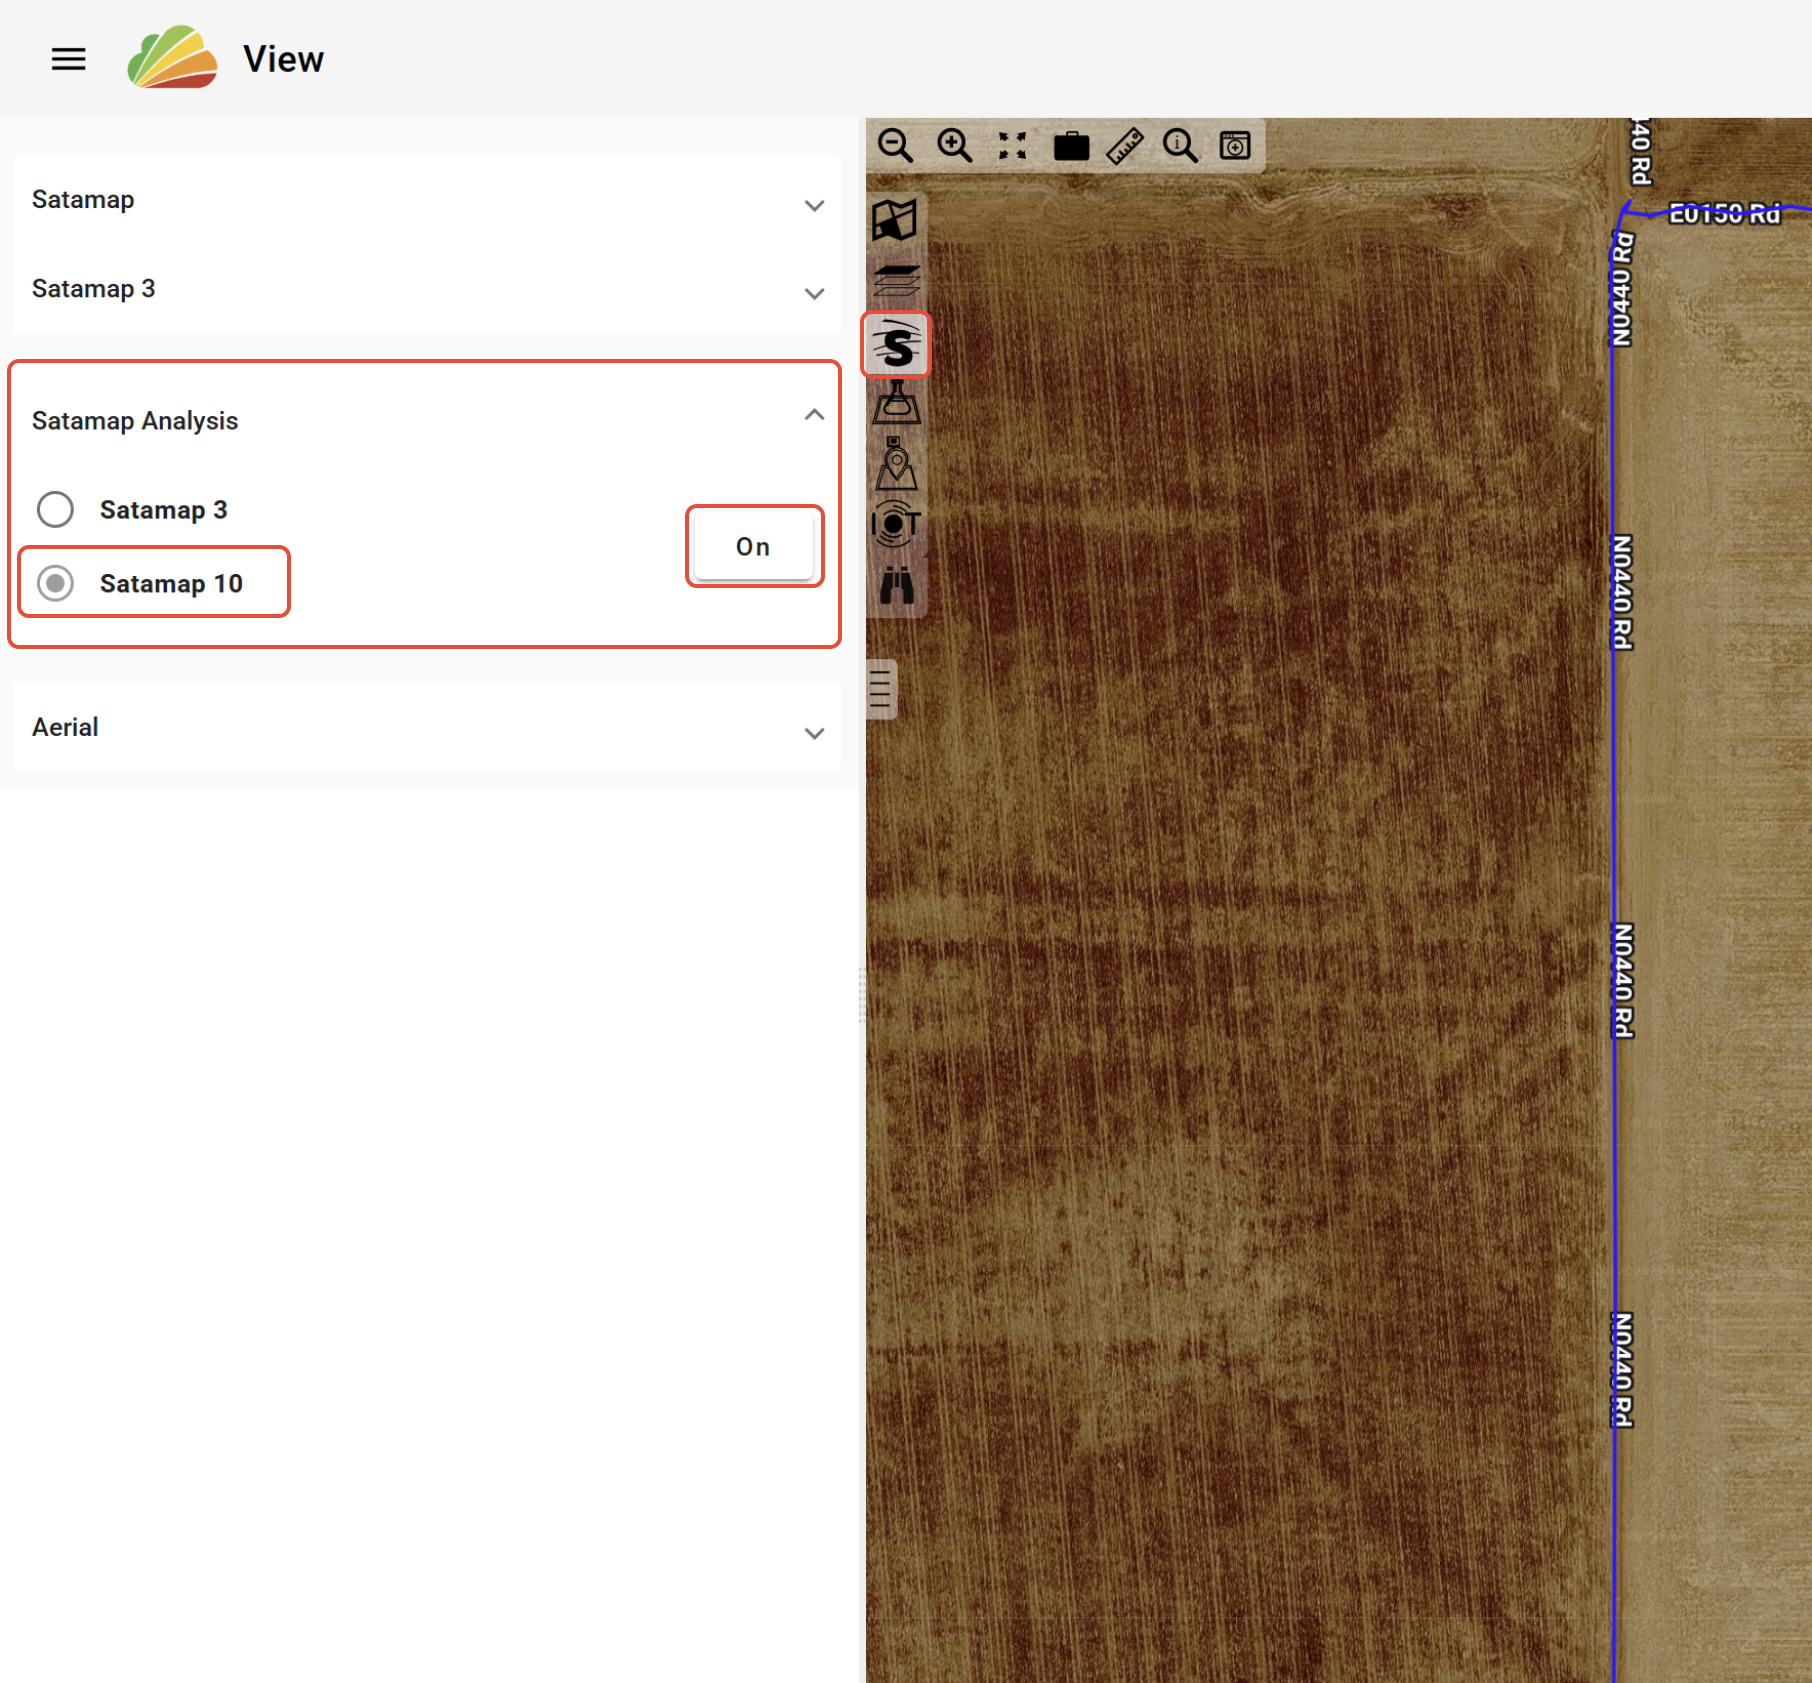
Selecting "On" for Satamap 10 will load Sentinel 2 imagery with PCT’s selection of indices for the fields selected in View.
Display
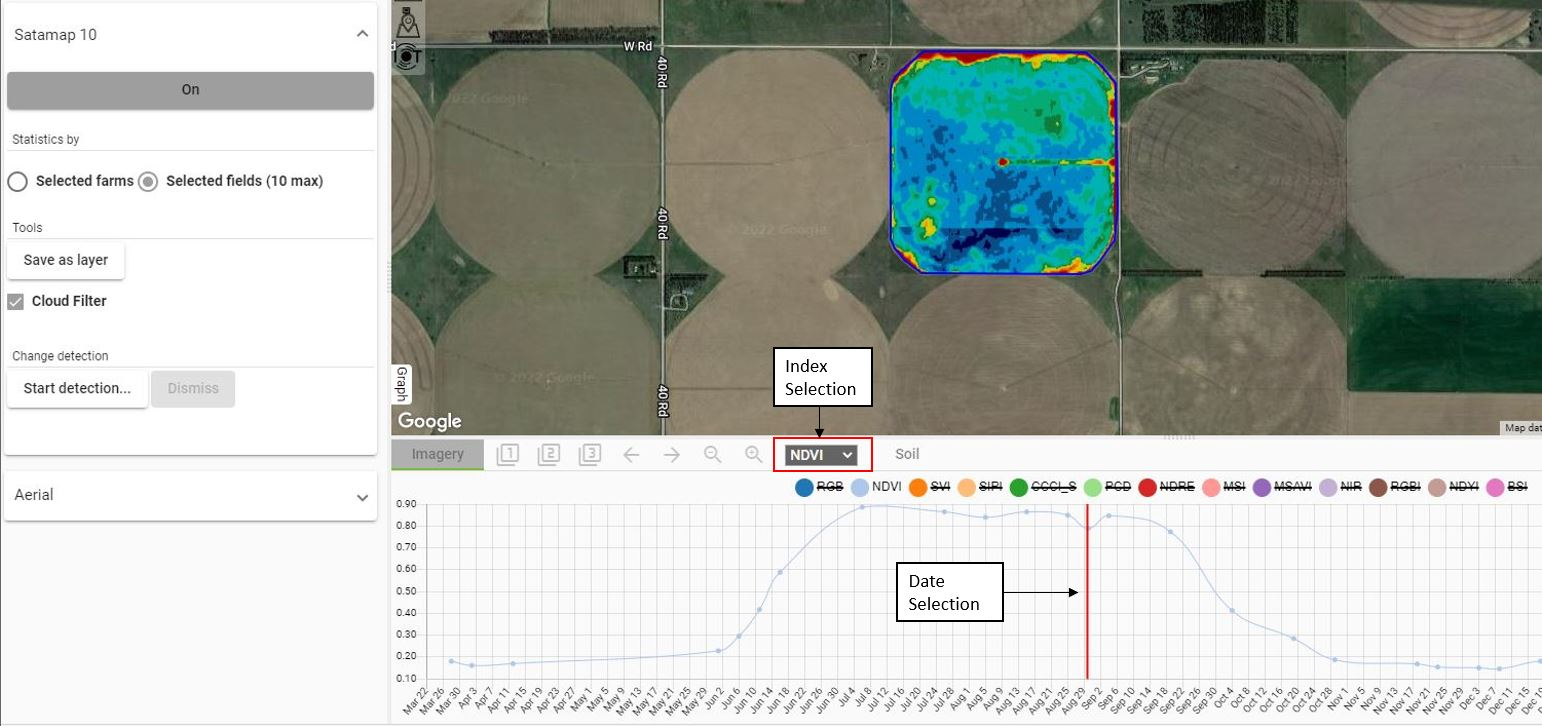
Indices can be changed in the drop-down menu. Date selection can be changed via the graph below the view window.
Graph
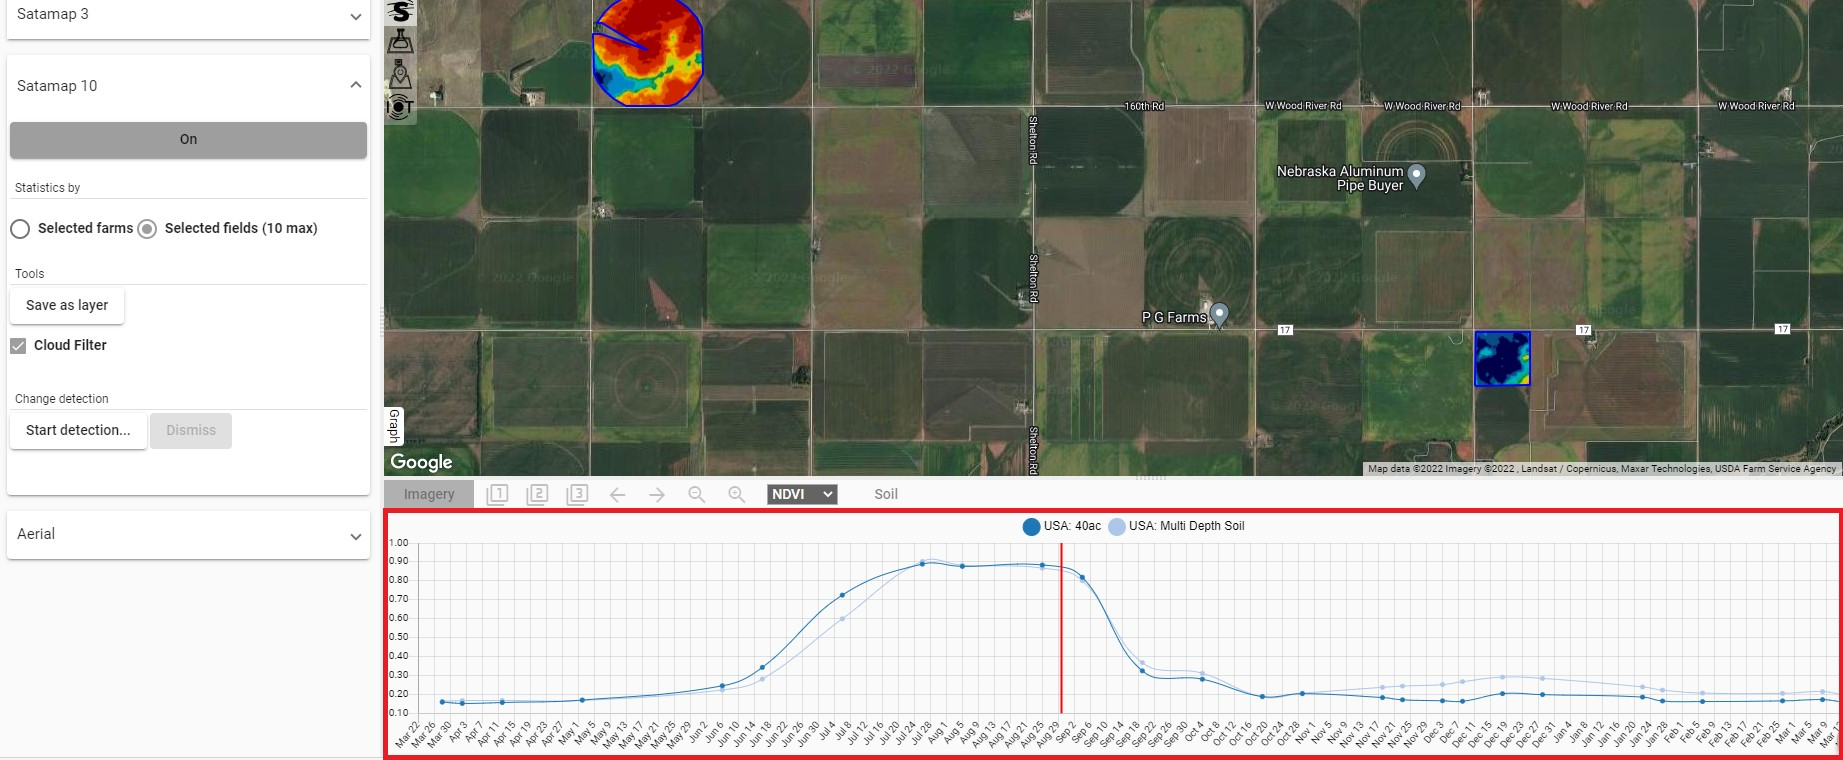
The chart at the bottom of the screen will show a colored line for each selected field. The dots within the lines represent different days of imagery over the course of a year. This chart and its respective lines will change depending on which index is chosen from the drop-down menu. When only one field is selected, all available indices will show as dots above the graph and can be selected for display/comparison in the graph.
Tools
Cloud Filter
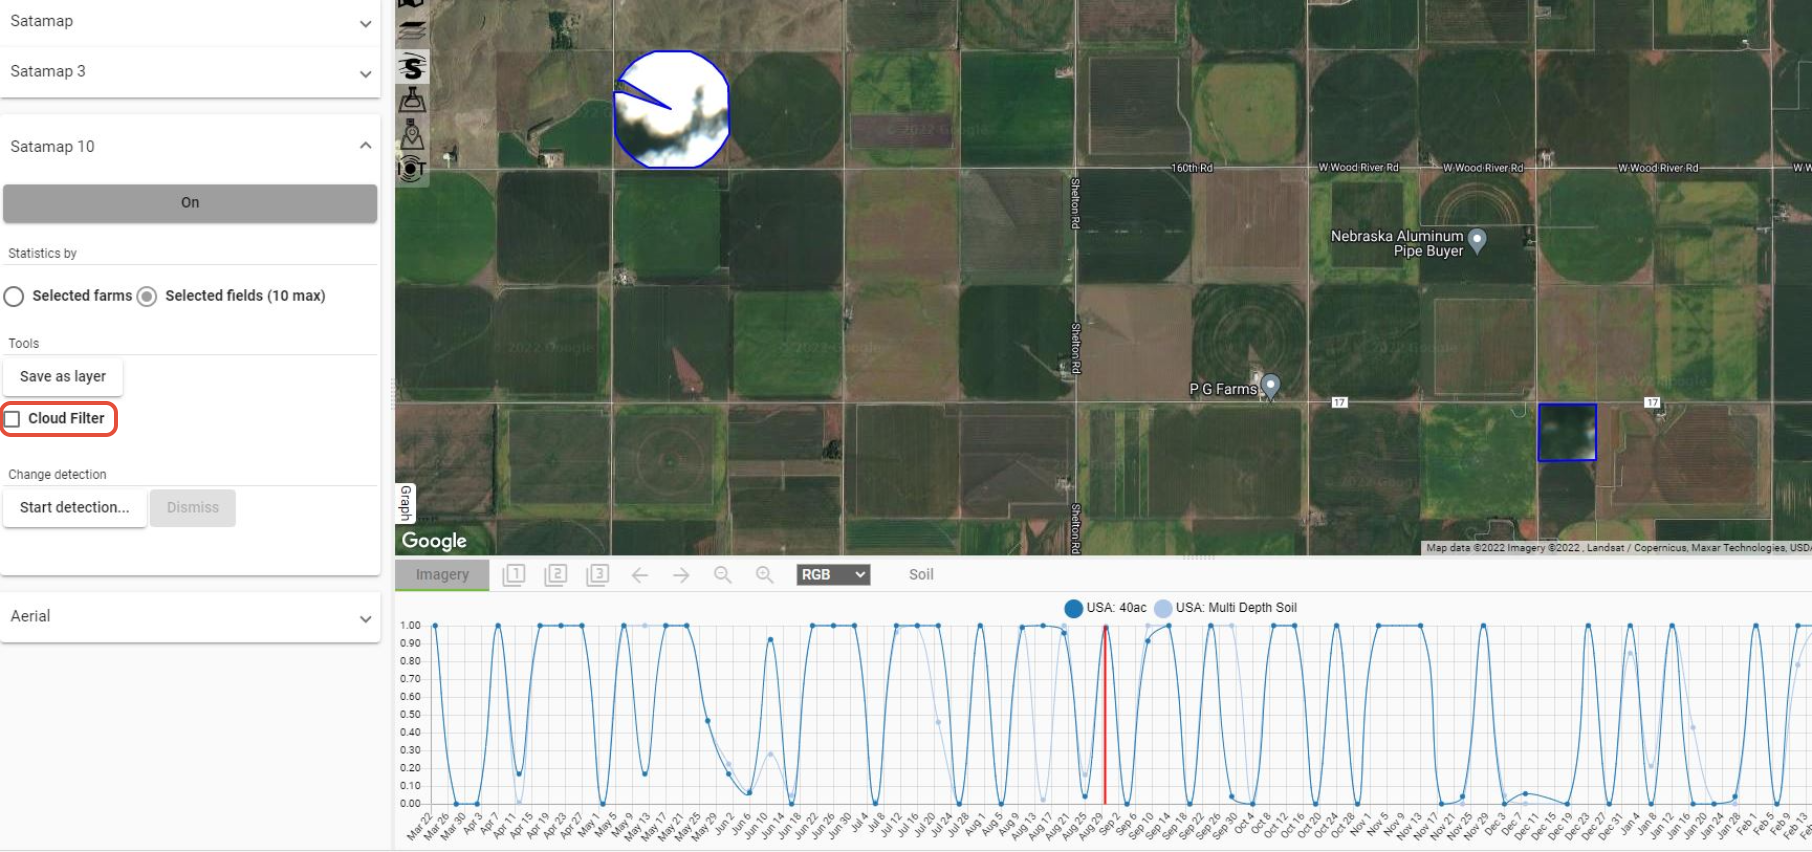
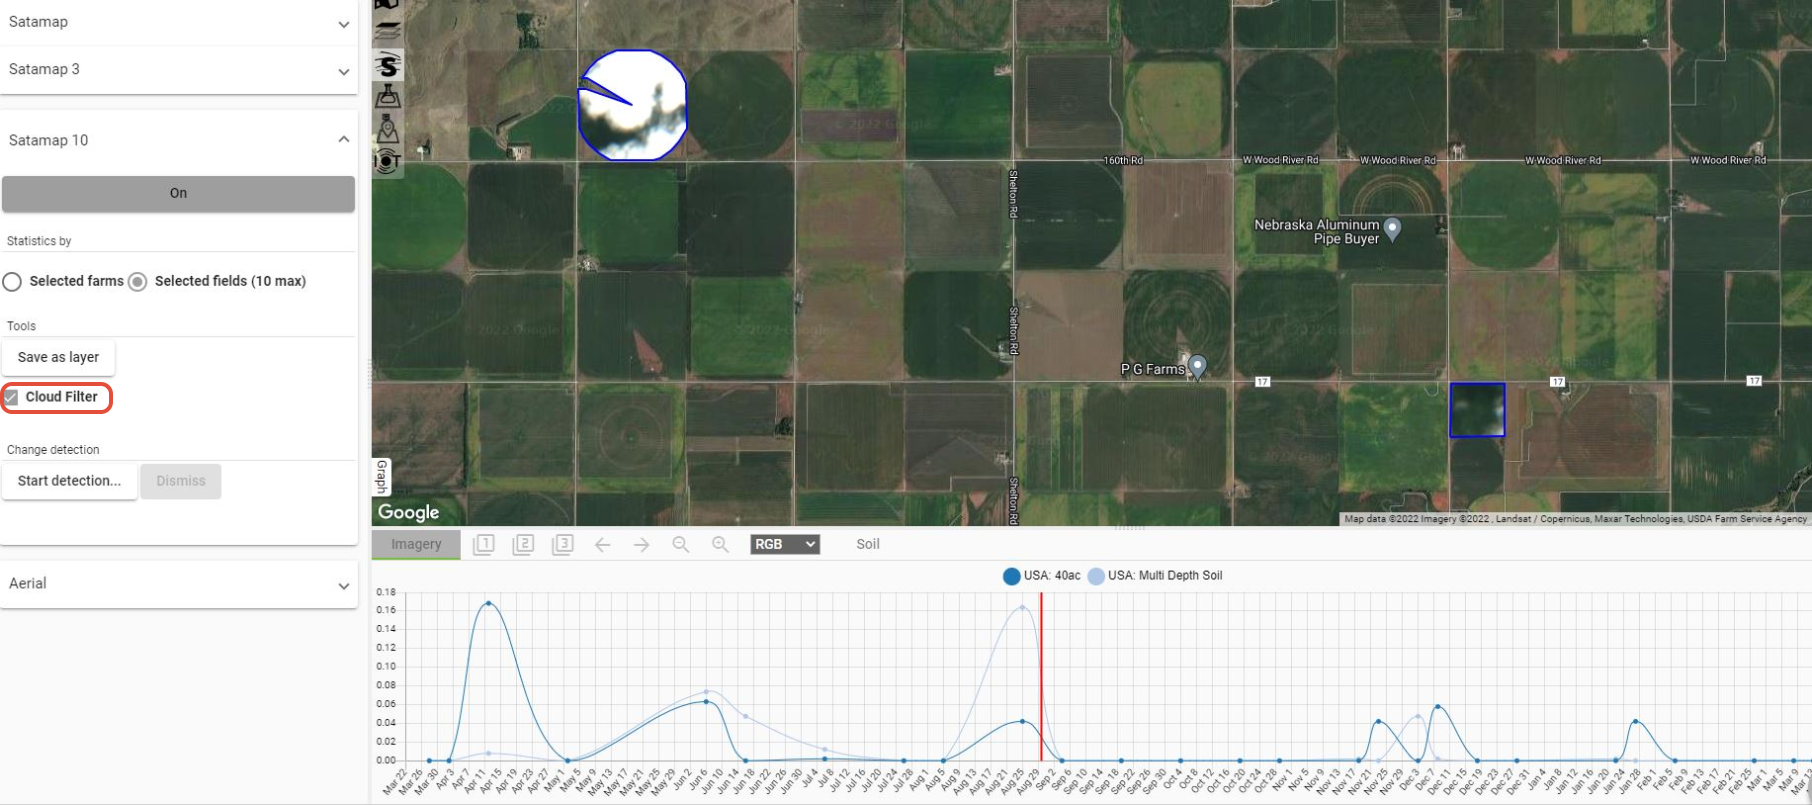
When selecting 'Cloud Filter', images in the date range will be included that were automatically filtered out. With 'Cloud Filter' off, the chart at the bottom will show all images no matter the cloud cover percentage.
With the 'Cloud Filter' On, the graph at the bottom will only show "Cloud Free" images available.
Save Layer
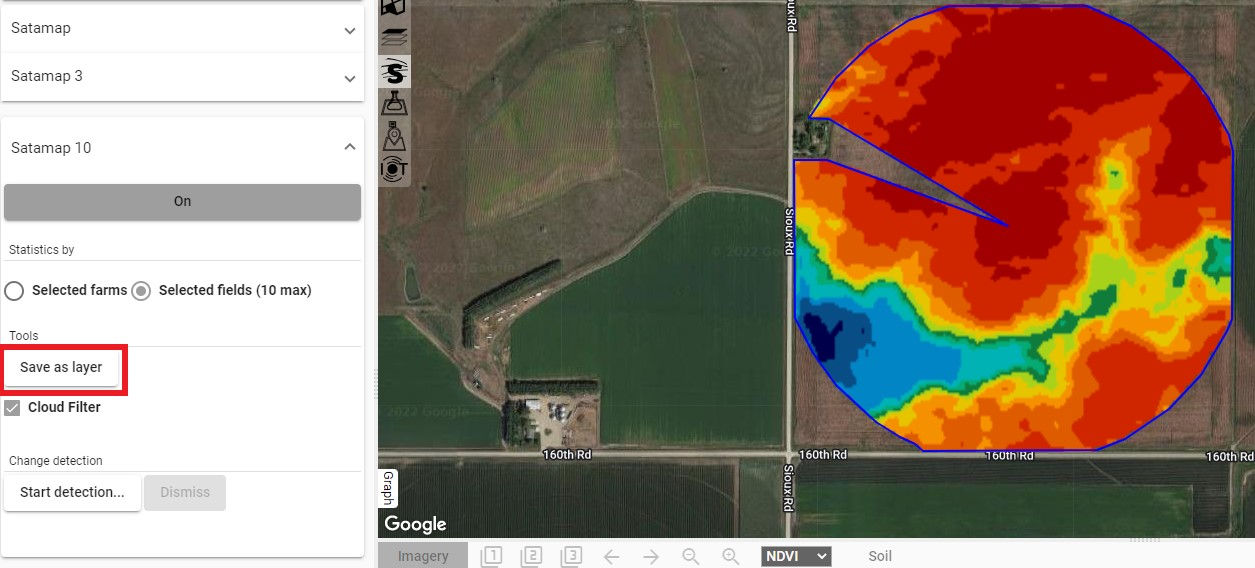
To save a specific image date as a layer, click 'Save as layer'.
Change Detection
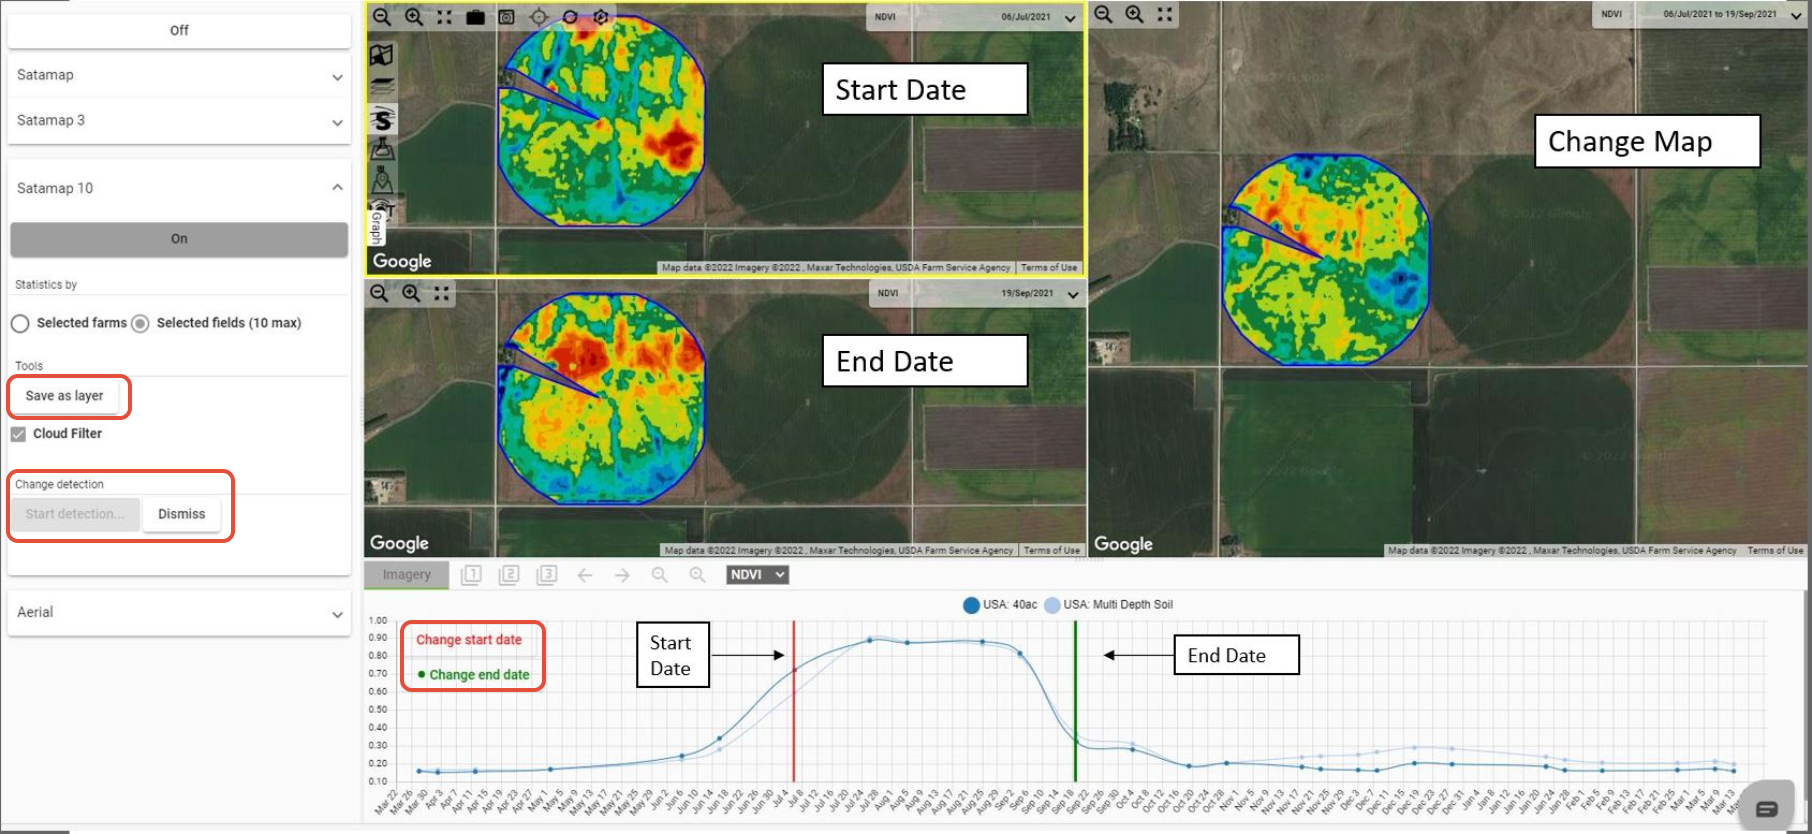
Change Detection will allow you to select a start and end date for a selected index and view the difference between the two images in the map. The top left map will display the Start Date, the bottom left will display the End Date, and the right map will display the Change Map. Click 'Save as layer' to save the Change Map as a layer.
Was this article helpful?
That’s Great!
Thank you for your feedback
Sorry! We couldn't be helpful
Thank you for your feedback
Feedback sent
We appreciate your effort and will try to fix the article