k-Means Clustering
k-Means Clustering is a machine-learning technique that is used to group similar data points. k-Means Clustering can be used to create management zones by grouping similar areas of a field based on their underlying characteristics. When performed correctly, the produced zones should group areas with similar landscape positions, soil composition, yield potential, and management requirements.
See the article and videos below to learn how to use the k-Means Clustering tool.
Create Clusters
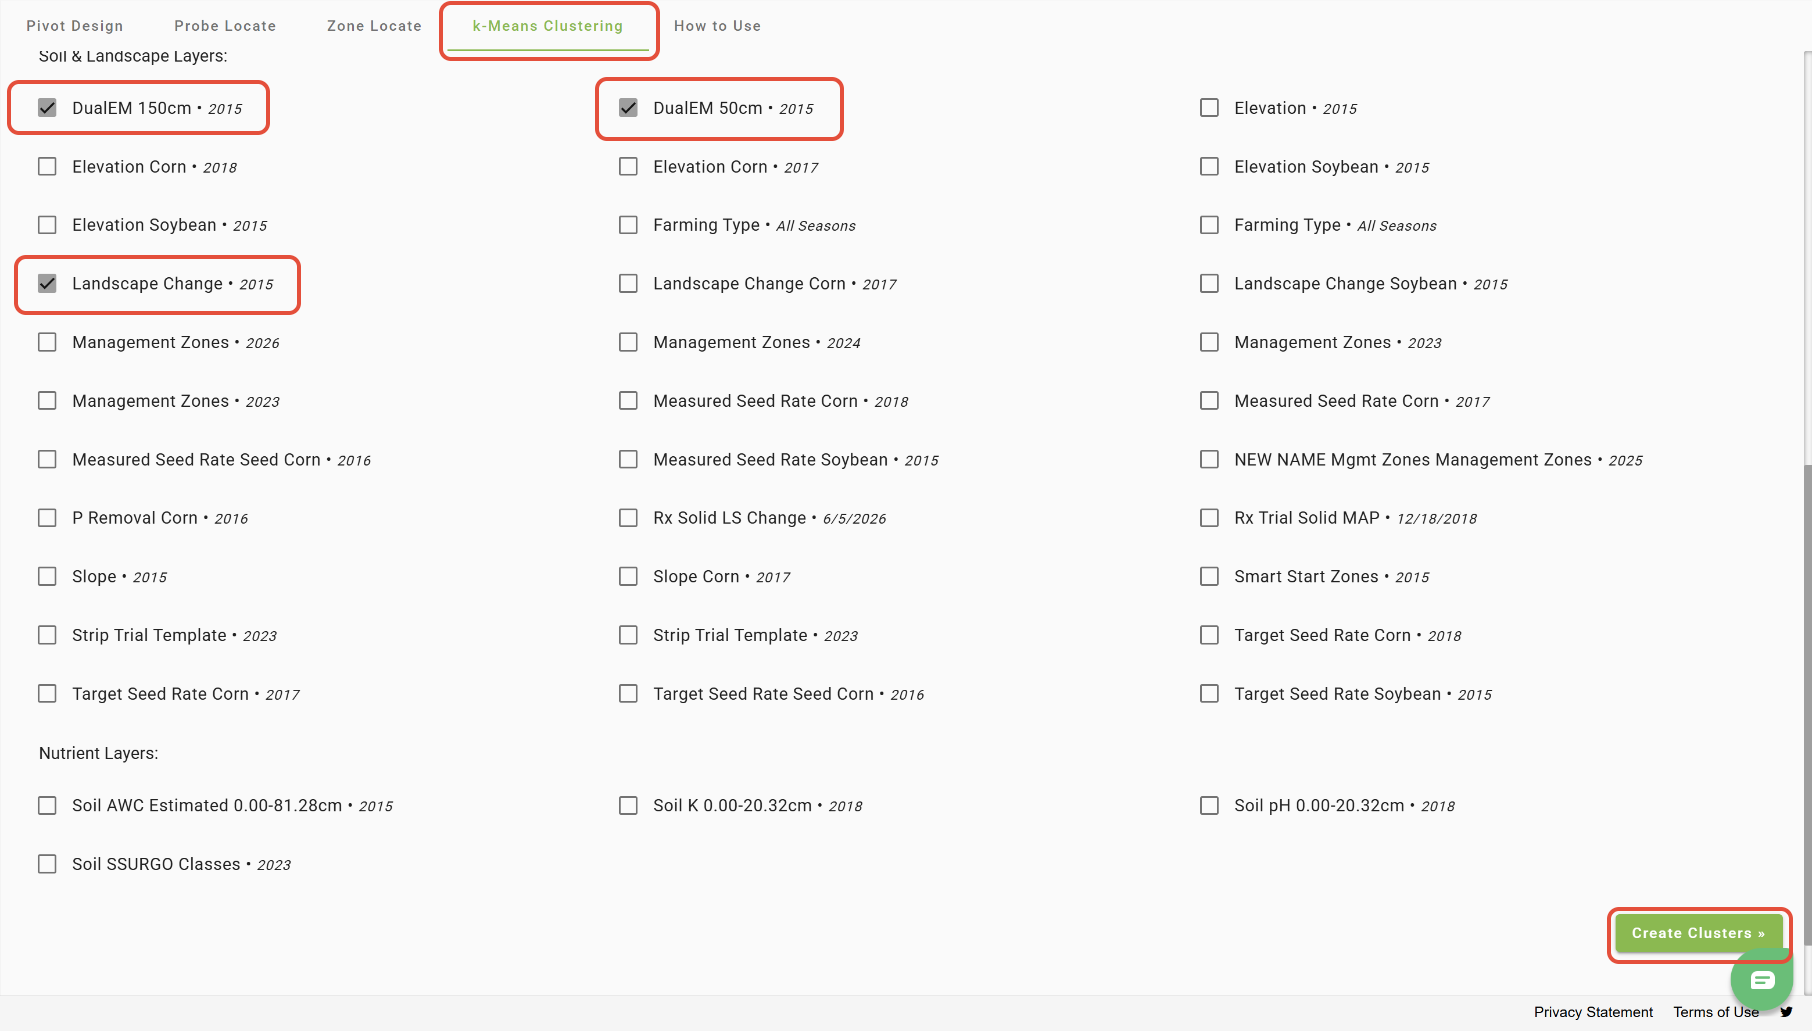
In the Zone/Locate tool with a Field selected, open the 'k-Means Clustering' tab, select the desired layers, and click 'Create Clusters'.
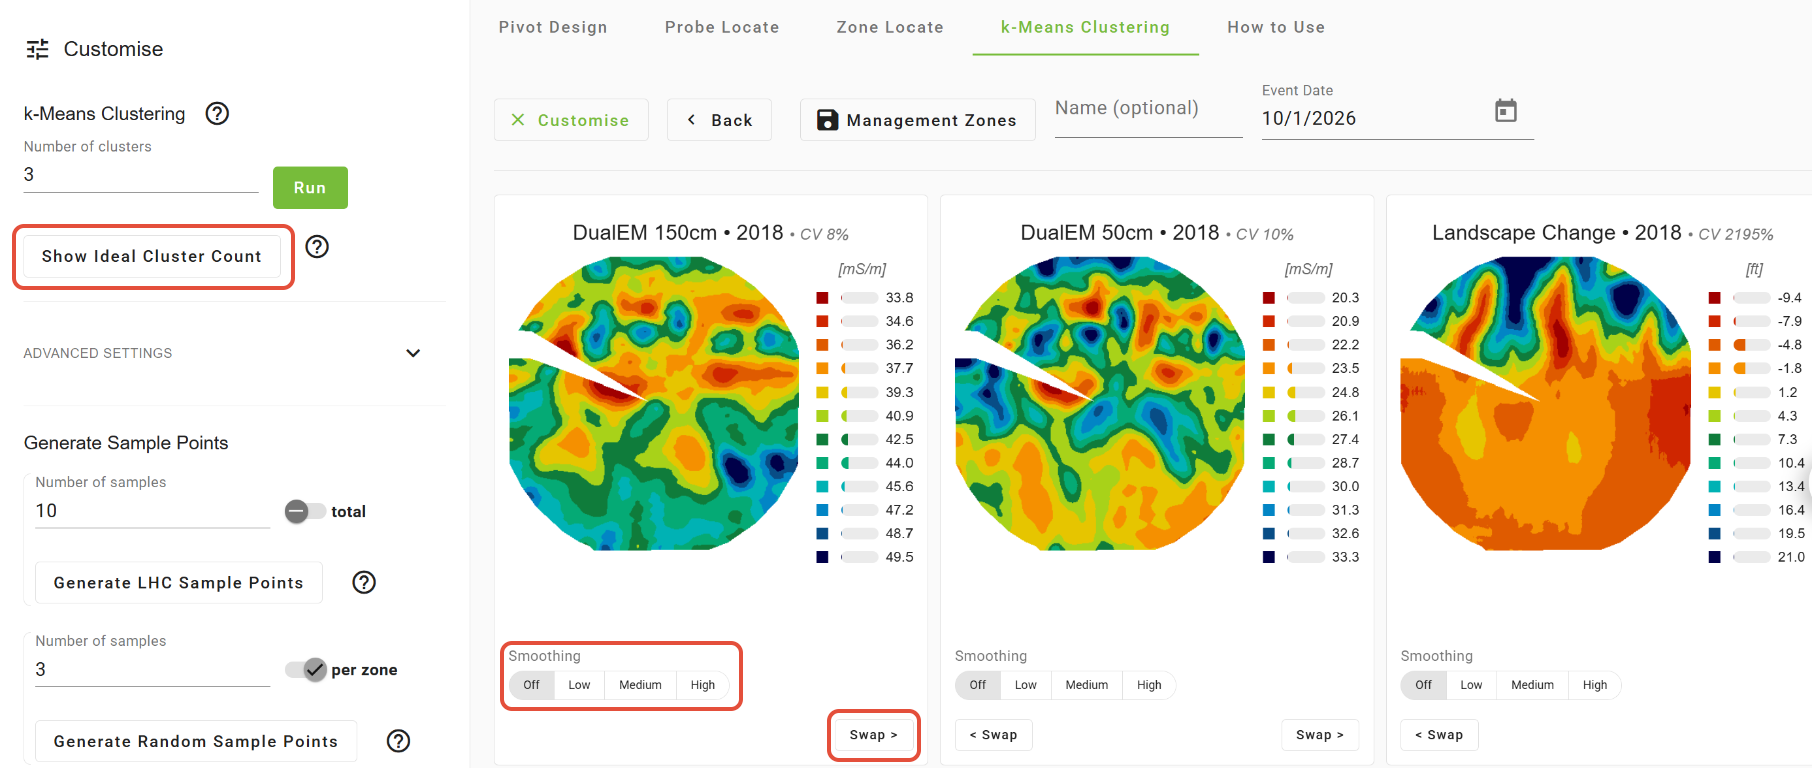
The order of the selected layers can be swapped, and smoothing can be applied to each layer individually.
Click the 'Show Ideal Cluster Count' button to run all scenarios from 2 to 10 clusters and choose the best scenario for the field based on the selected layers.
-Note: The ideal number of clusters for each field will differ depending on the within-field variability and intended management practices.
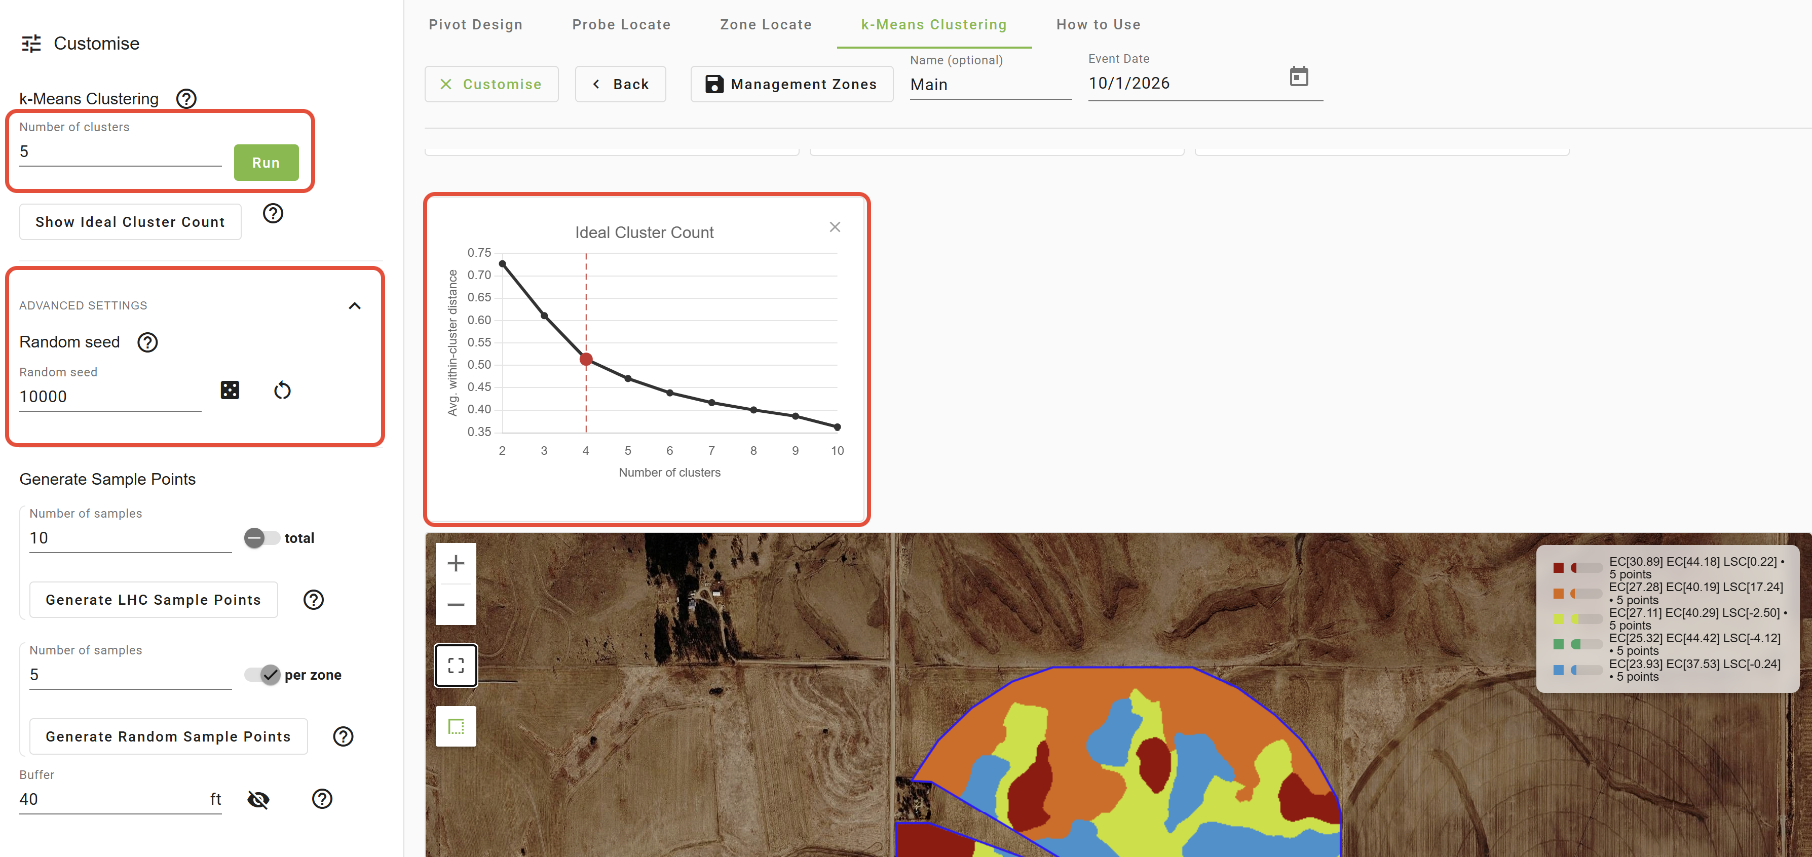
As the number of clusters increases, the Within-Cluster Sum of Squares (WCSS) tends to decrease. The ideal number of clusters is the "elbow" point of the plot, where the rate of decrease in WCSS significantly slows down. This point will be automatically determined and selected when using the 'Show Ideal Cluster Count' option. This point represents a good balance between minimizing within-cluster variability and avoiding excessive fragmentation into small clusters.
However, the elbow method is only a guide; it is not definitive. It is important to strike a balance between finding a reasonable number of clusters and ensuring they have practical and interpretable implications. The number of clusters can be manually entered and run if needed.
Under the 'Advanced Settings' dropdown, a random seed value can be entered to force the algorithm into choosing the same starting positions every time the clusters are run.
To eliminate small zones, use the "Consolidate small areas" option.
Once the ideal number of clusters has been determined, enter a name for the layer if needed, choose a save date, and click the 'Save Management Zones' button to save the layer.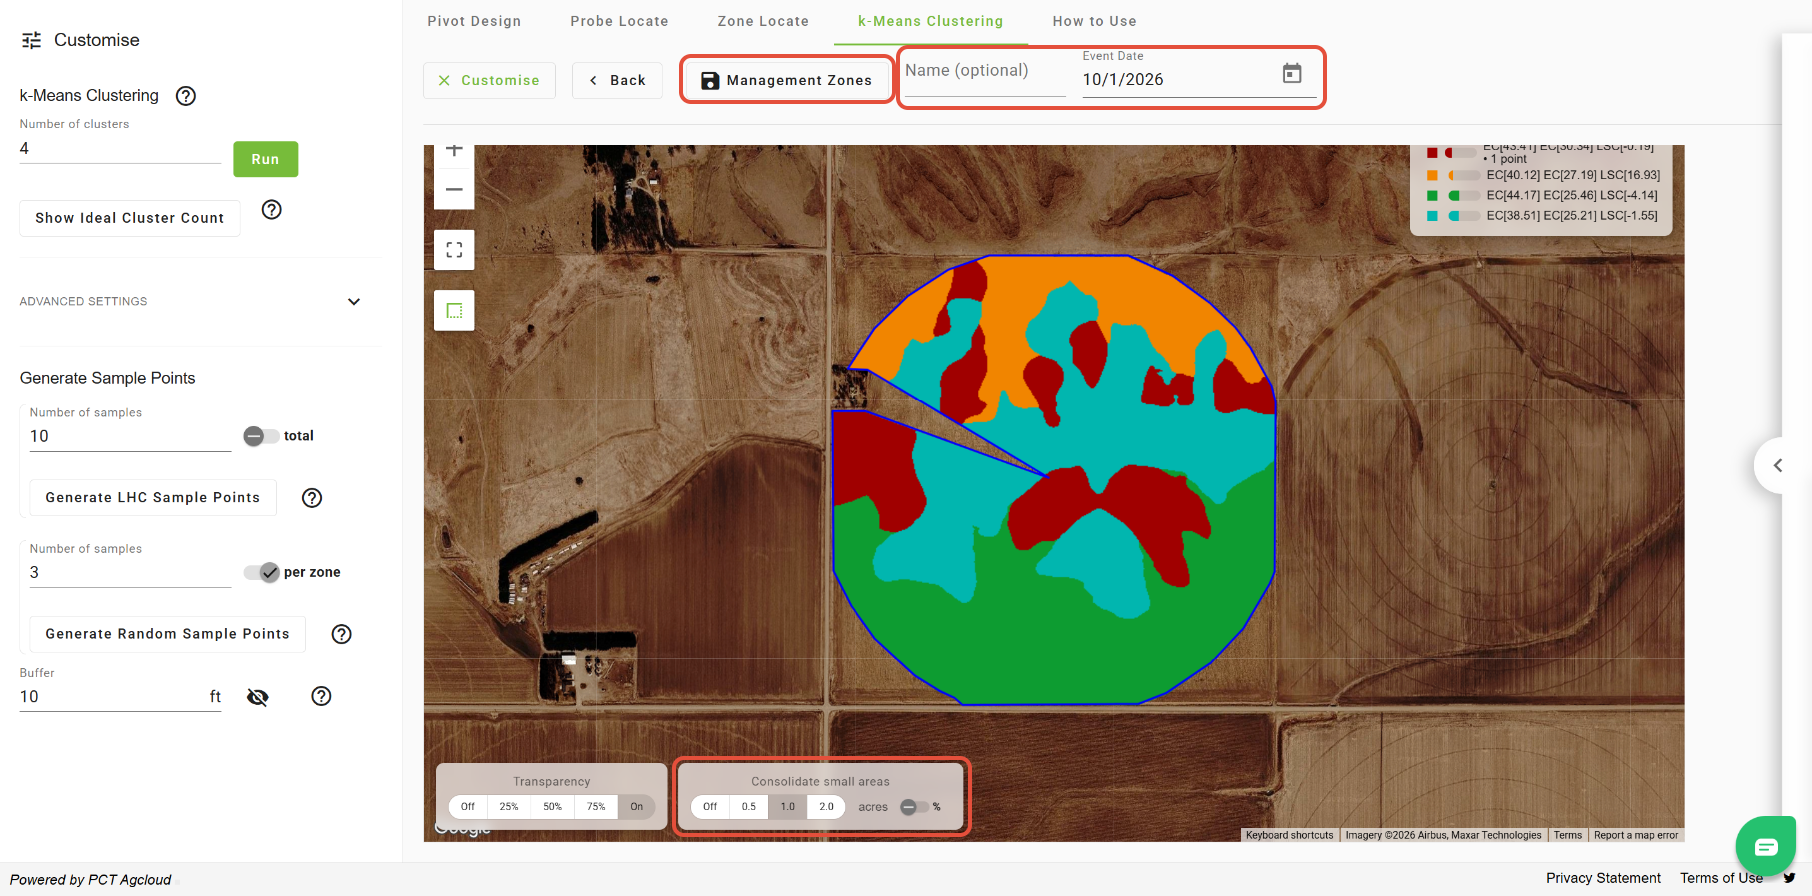
Sample Locations
As with other zoning tools in PCT Agcloud, you have the option to place or generate sample points within the k-Means Clustering tool.
To place individual points on the map, simply click on the zoned map.
Soil sampling plans can also be generated using either stratified random sampling with the 'Generate Random Sample Points' button or conditioned Latin hypercube sampling with the 'Generate LHC Sample Points' button.
The 'Generate LHC Sample Points' option considers data in the input layers to optimize where the sampling sites are located. The samples are positioned so that they capture the maximum amount of variability in the input layers from the given number of sampling locations. This minimizes correlation between sampling points and increases the overall efficiency of the sampling plan.
The number of LHC points to be plotted can be determined by a total number or by acre. LHC will not necessarily put an equal number of samples in each zone. A buffer around the field and zone boundaries can be applied so that the points are not placed on the edges. Once the points have been plotted, open the pane on the right side and click 'Save'. 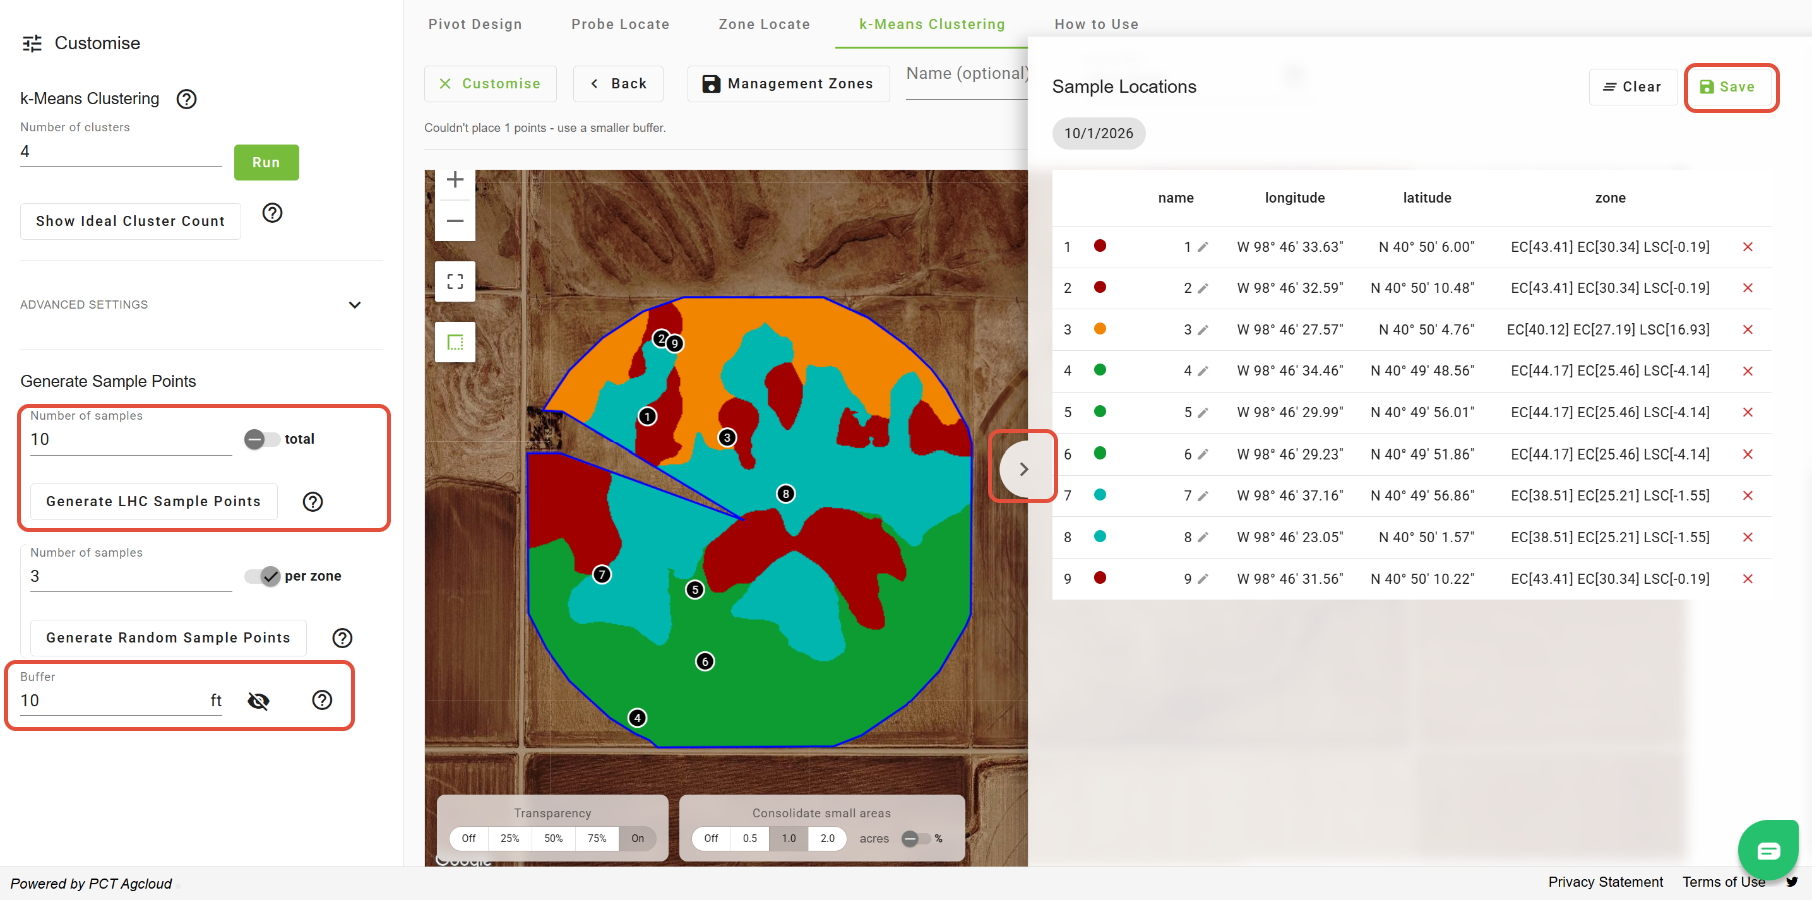
The 'Generate Random Sample Points' option only utilizes the developed management zone layer and allocates the given number of samples randomly within each zone. Or the samples can be plotted randomly across the field without taking the zones into account. A buffer around the field and zone boundaries can be applied so that the points are not placed on the edges. Once the points have been plotted, open the pane on the right side and click 'Save'. 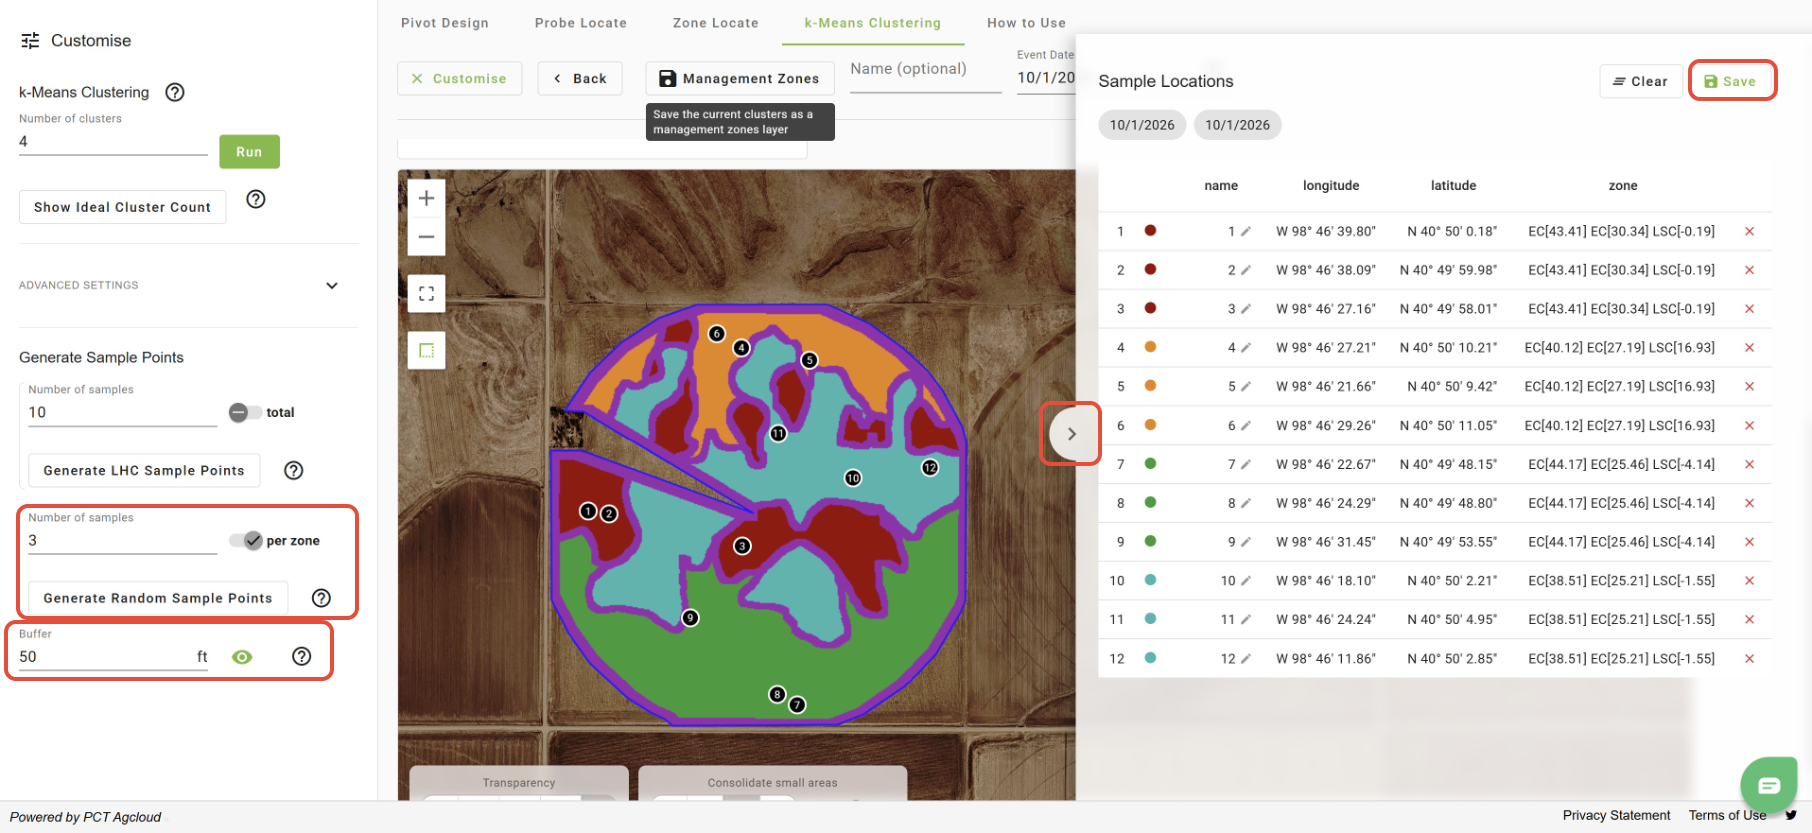
Was this article helpful?
That’s Great!
Thank you for your feedback
Sorry! We couldn't be helpful
Thank you for your feedback
Feedback sent
We appreciate your effort and will try to fix the article