The Strip Trial tab in the Analytics tool can be used to gauge yield response as well as gain financial insights from field trials. See the videos and article below to learn more.
Steps:
In the example below, a Strip Trial Template layer that was created using the Test Strip Setup tool is used. For info on the Test Strip Setup tool, click HERE. Strip trials can also be created within the Strip Trial Analytics tool. A Strip Trial Template layer is not necessary to run the tool.
1. Under the 'Strip Trial' tab in the Analytics tool, with a Field selected, choose the desired layer(s) and click 'Run Analysis'.
-Note: Multiple layers can be selected, and layers other than Strip Trial Template layers can be selected.

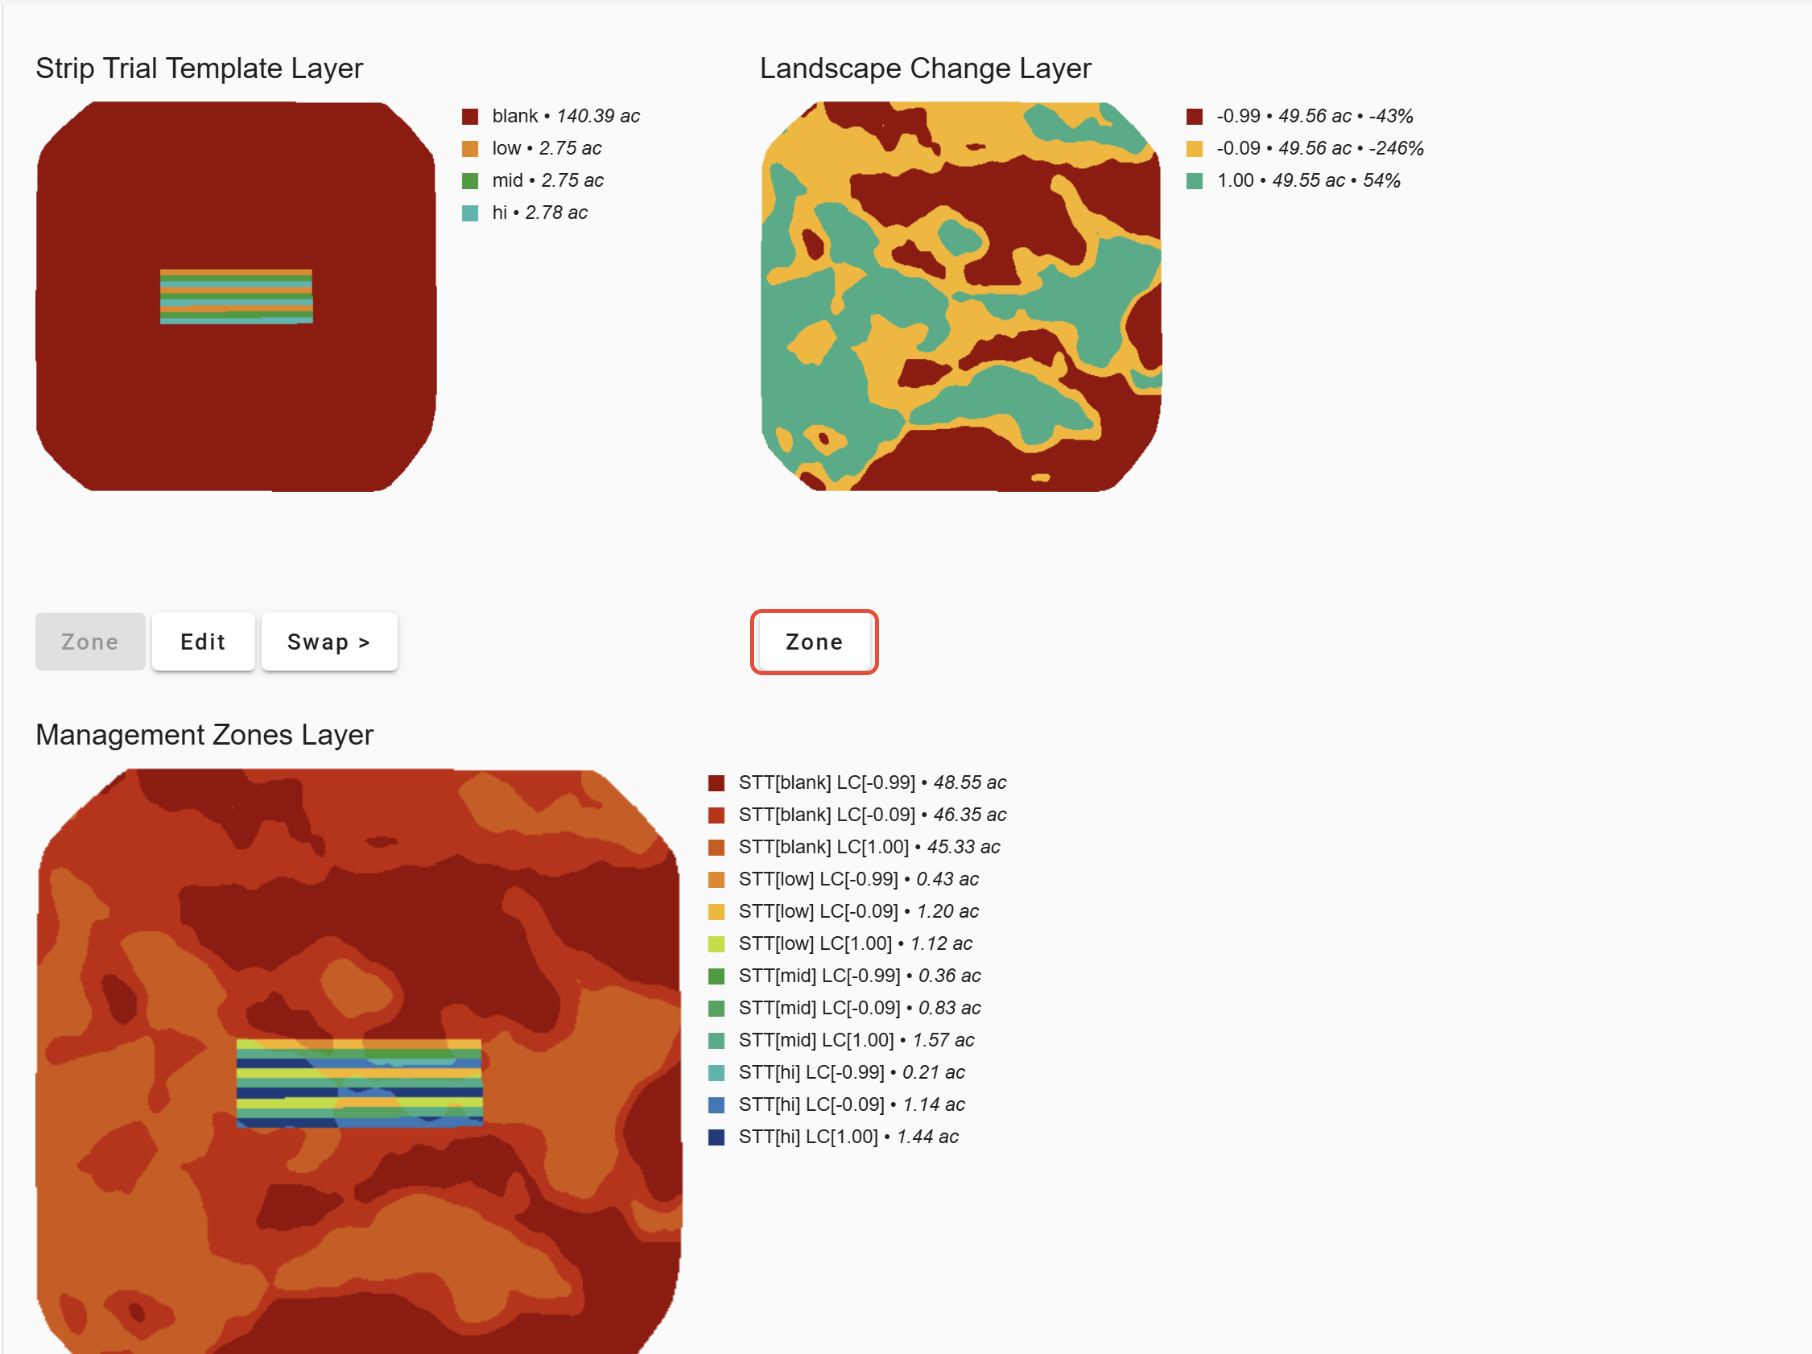
2. If an unzoned layer was selected, click 'Zone' to adjust the classification settings that were applied to that layer.

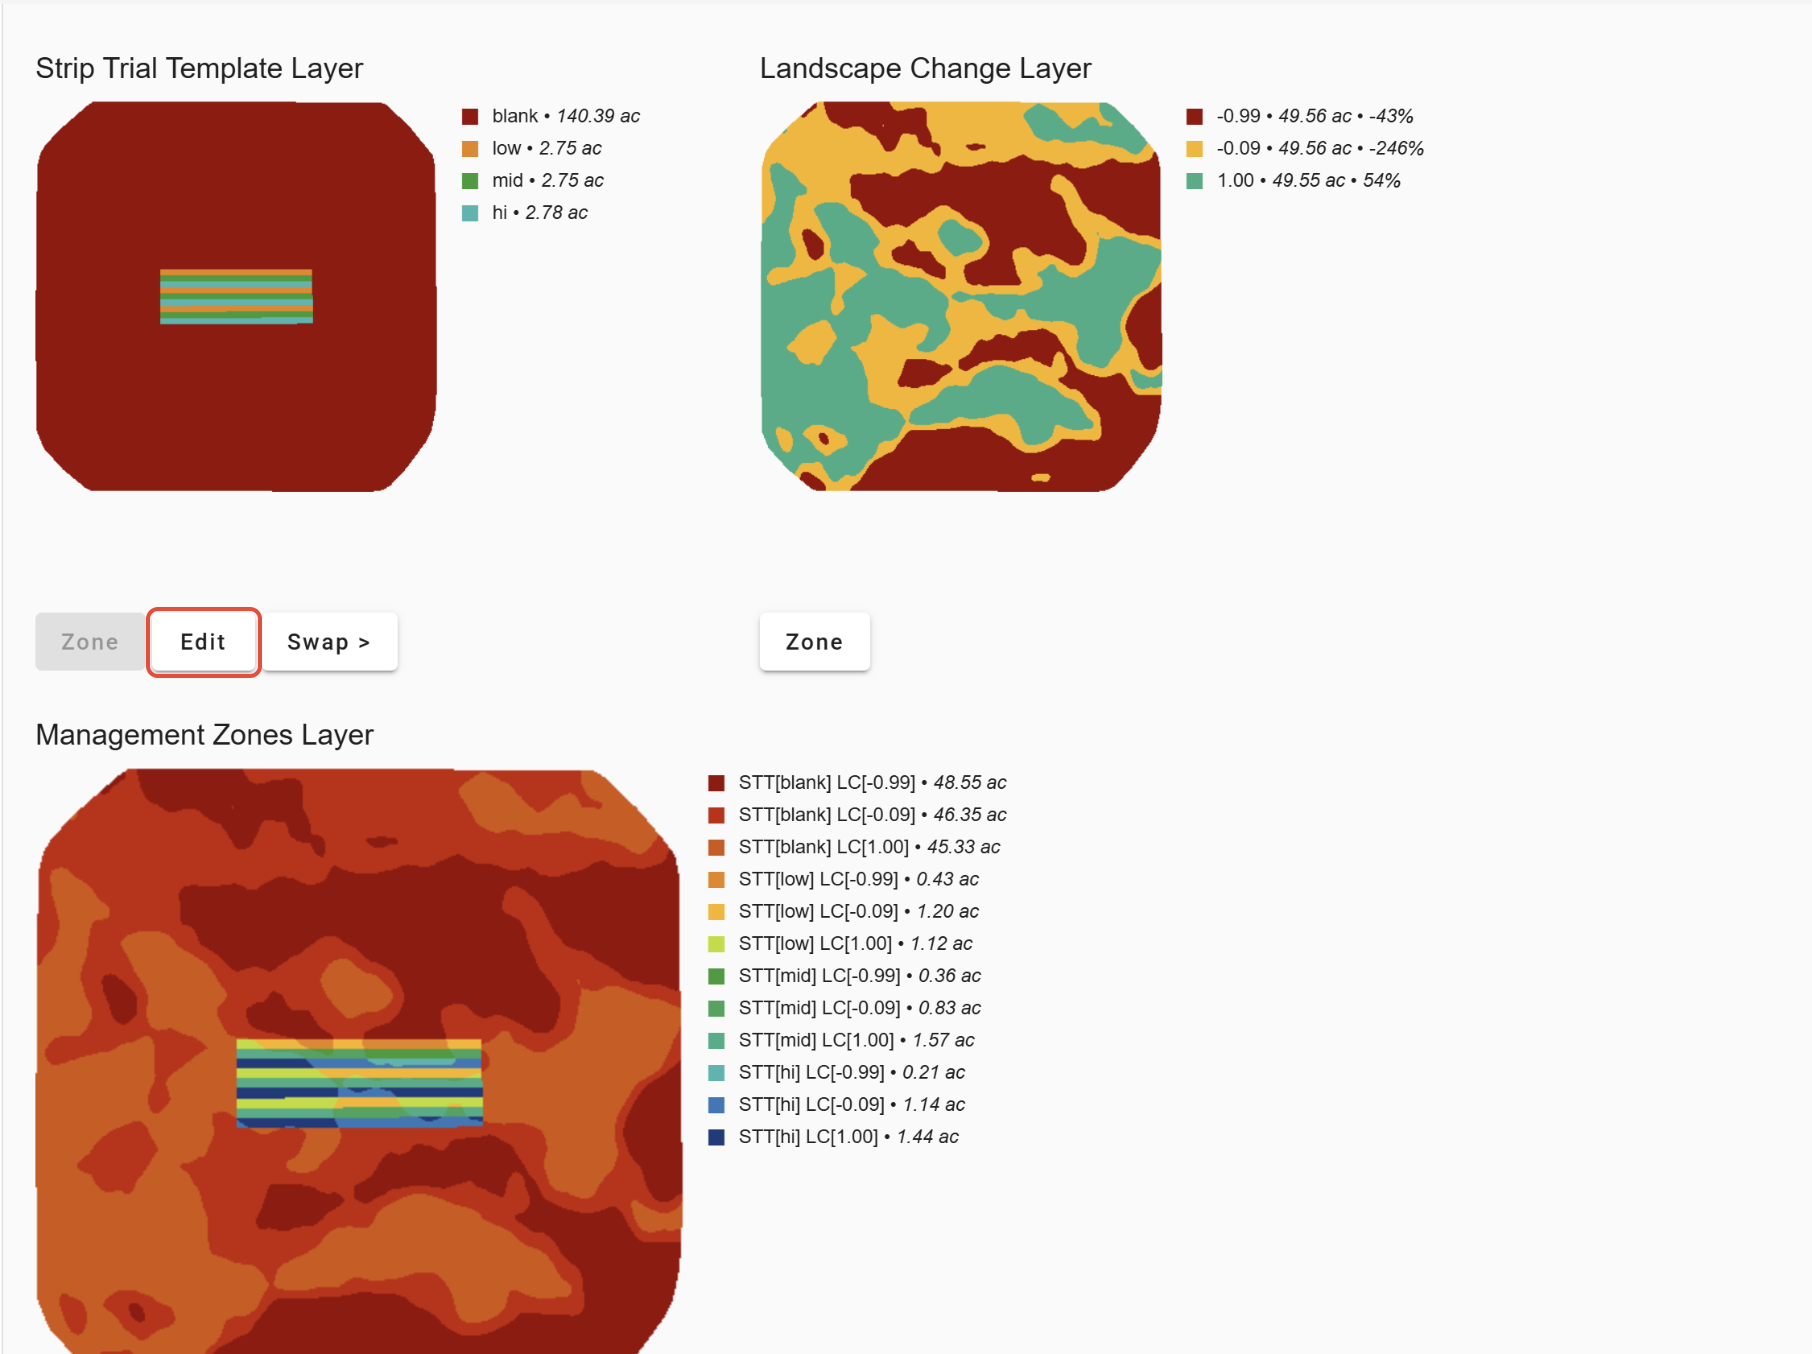
3. To manually edit the zones/strips of the Strip Trial layer, click 'Edit'.
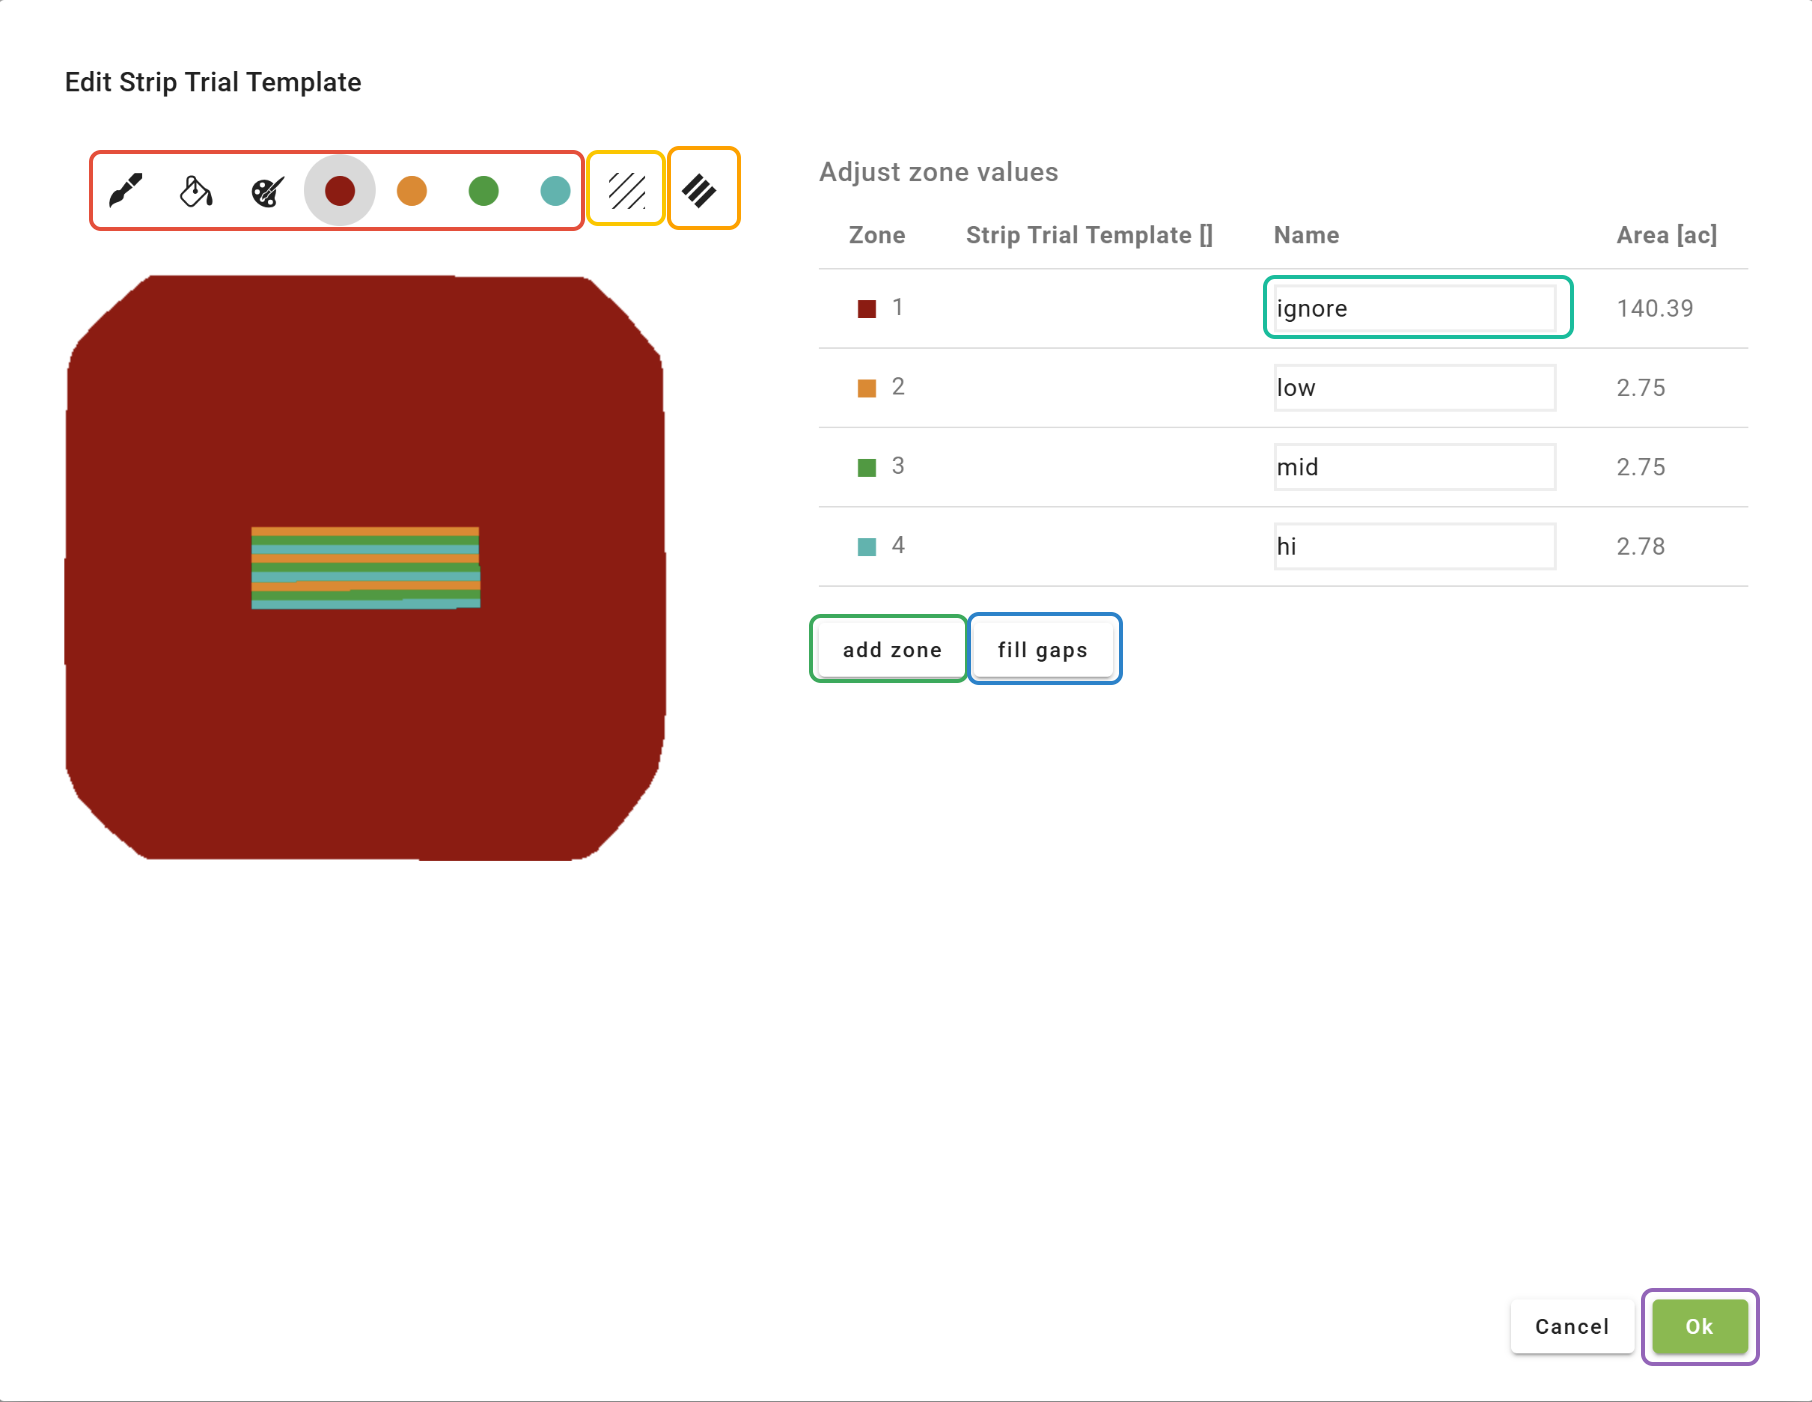
4. In the 'Edit' option, click the 'Color palette' to select a zone, then choose a paint tool to manually edit the layer.
5. Click 'add zone' to add a new zone.
6. Click the 'fill gaps' button to fill in any spaces between strips and designate them as a new treatment.
7. Click the 'Show AB Lines' button to display available AB lines.
8. Click the 'Add test strips' button to add additional trials to the layer. (If additional strips are added to the layer, be sure to assign names in the "Name" column before saving.)
9. To remove a zone from the analysis, type "ignore" in the name box for that zone.
10. When finished, click 'Ok'.
11. To compare the selected layer(s) to Yield or Imagey, choose an option from the "Yield Comparison" section. Additional layers can be added to the analysis via the ‘2nd layer’ dropdown.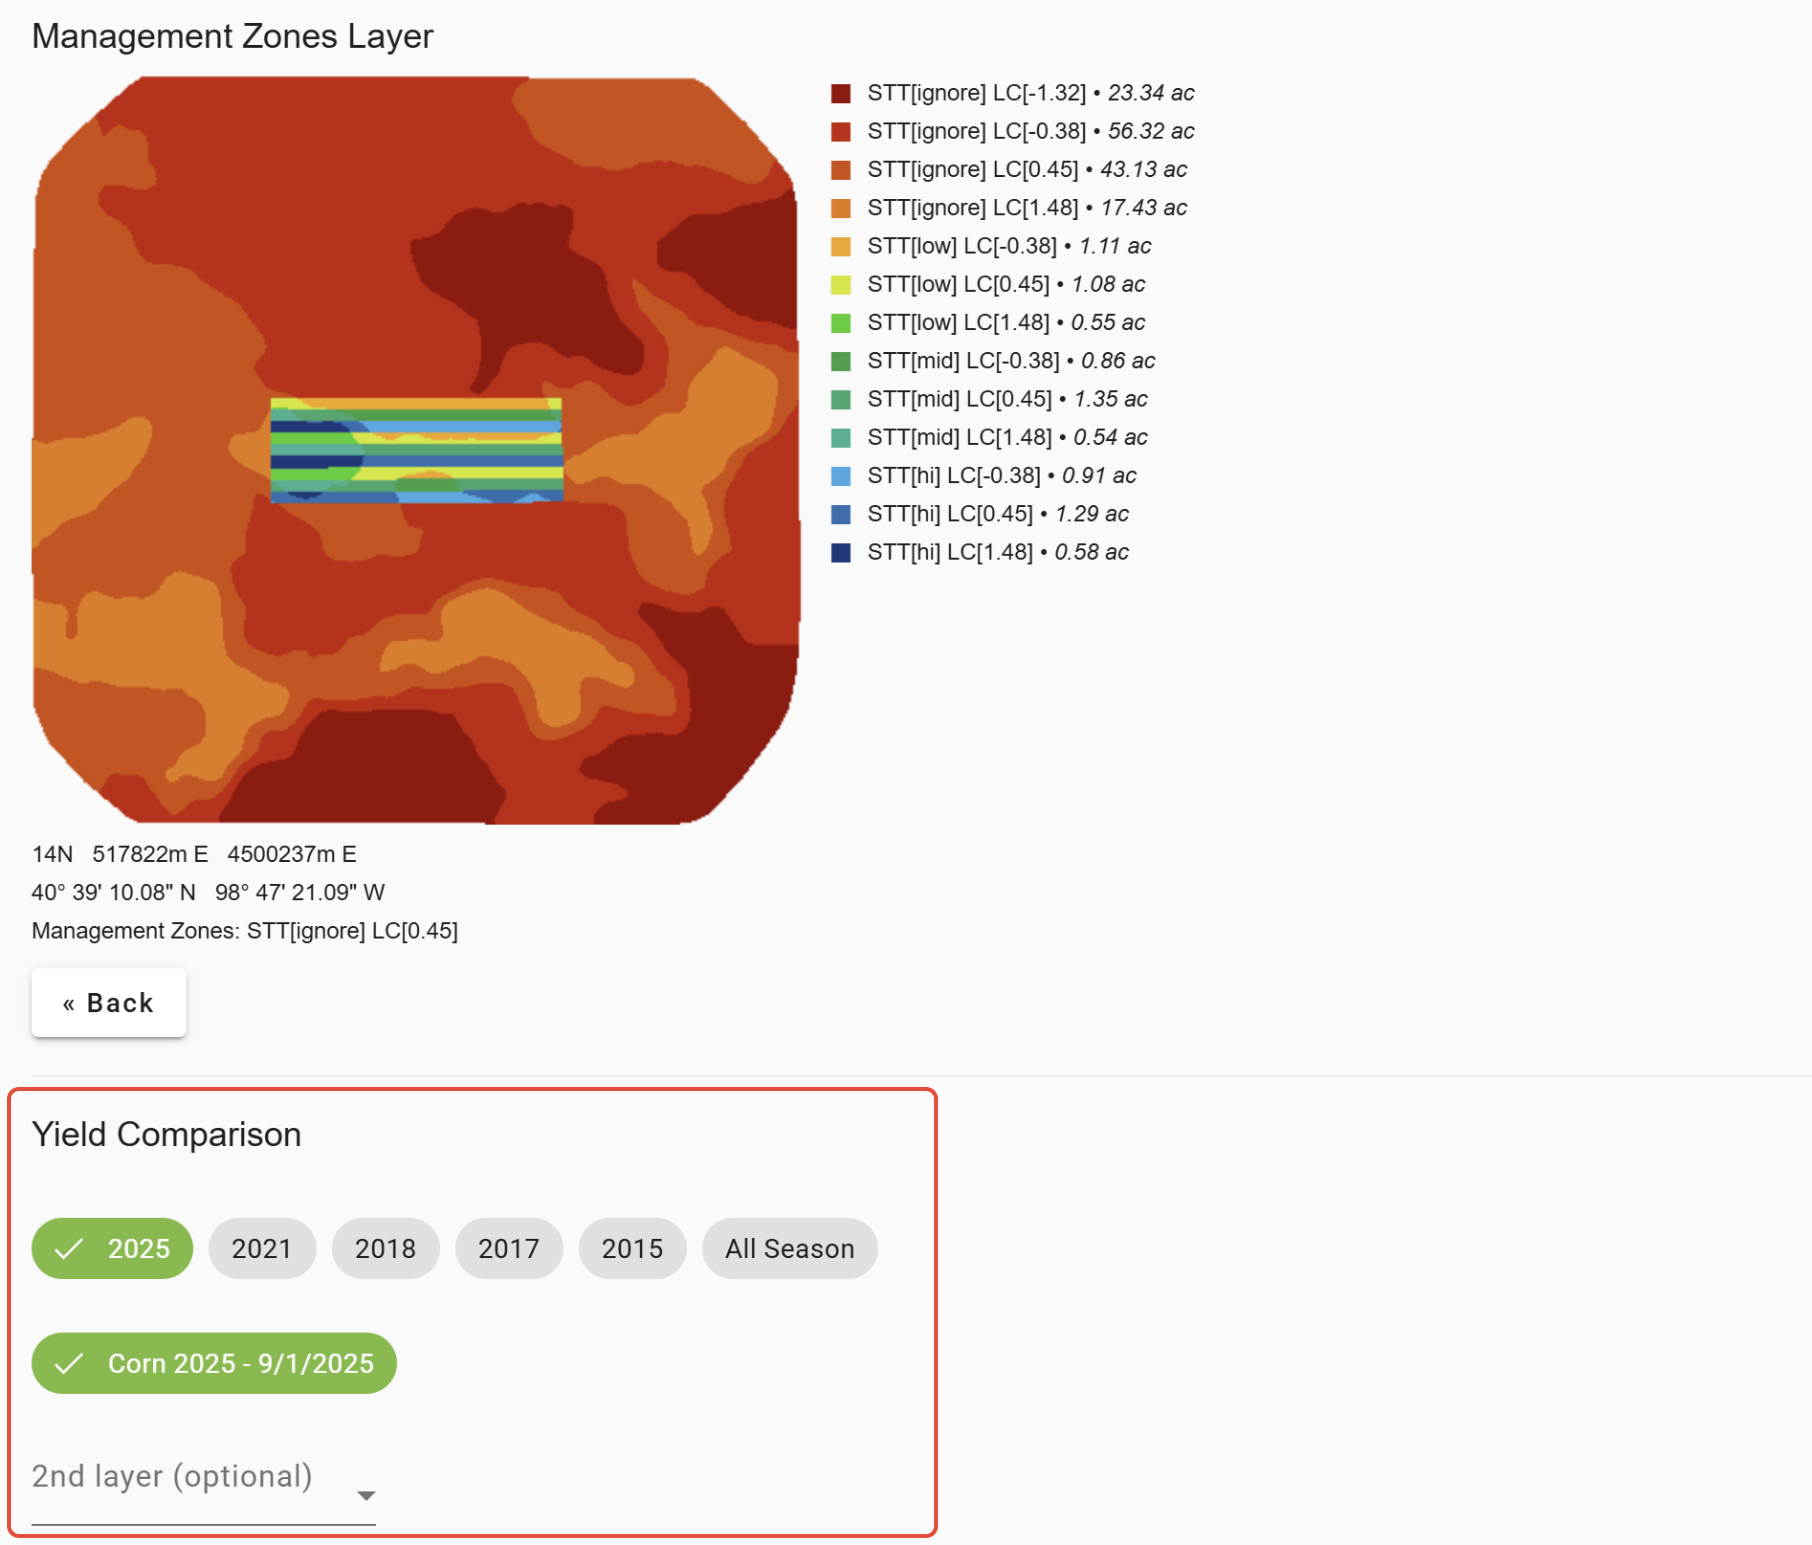
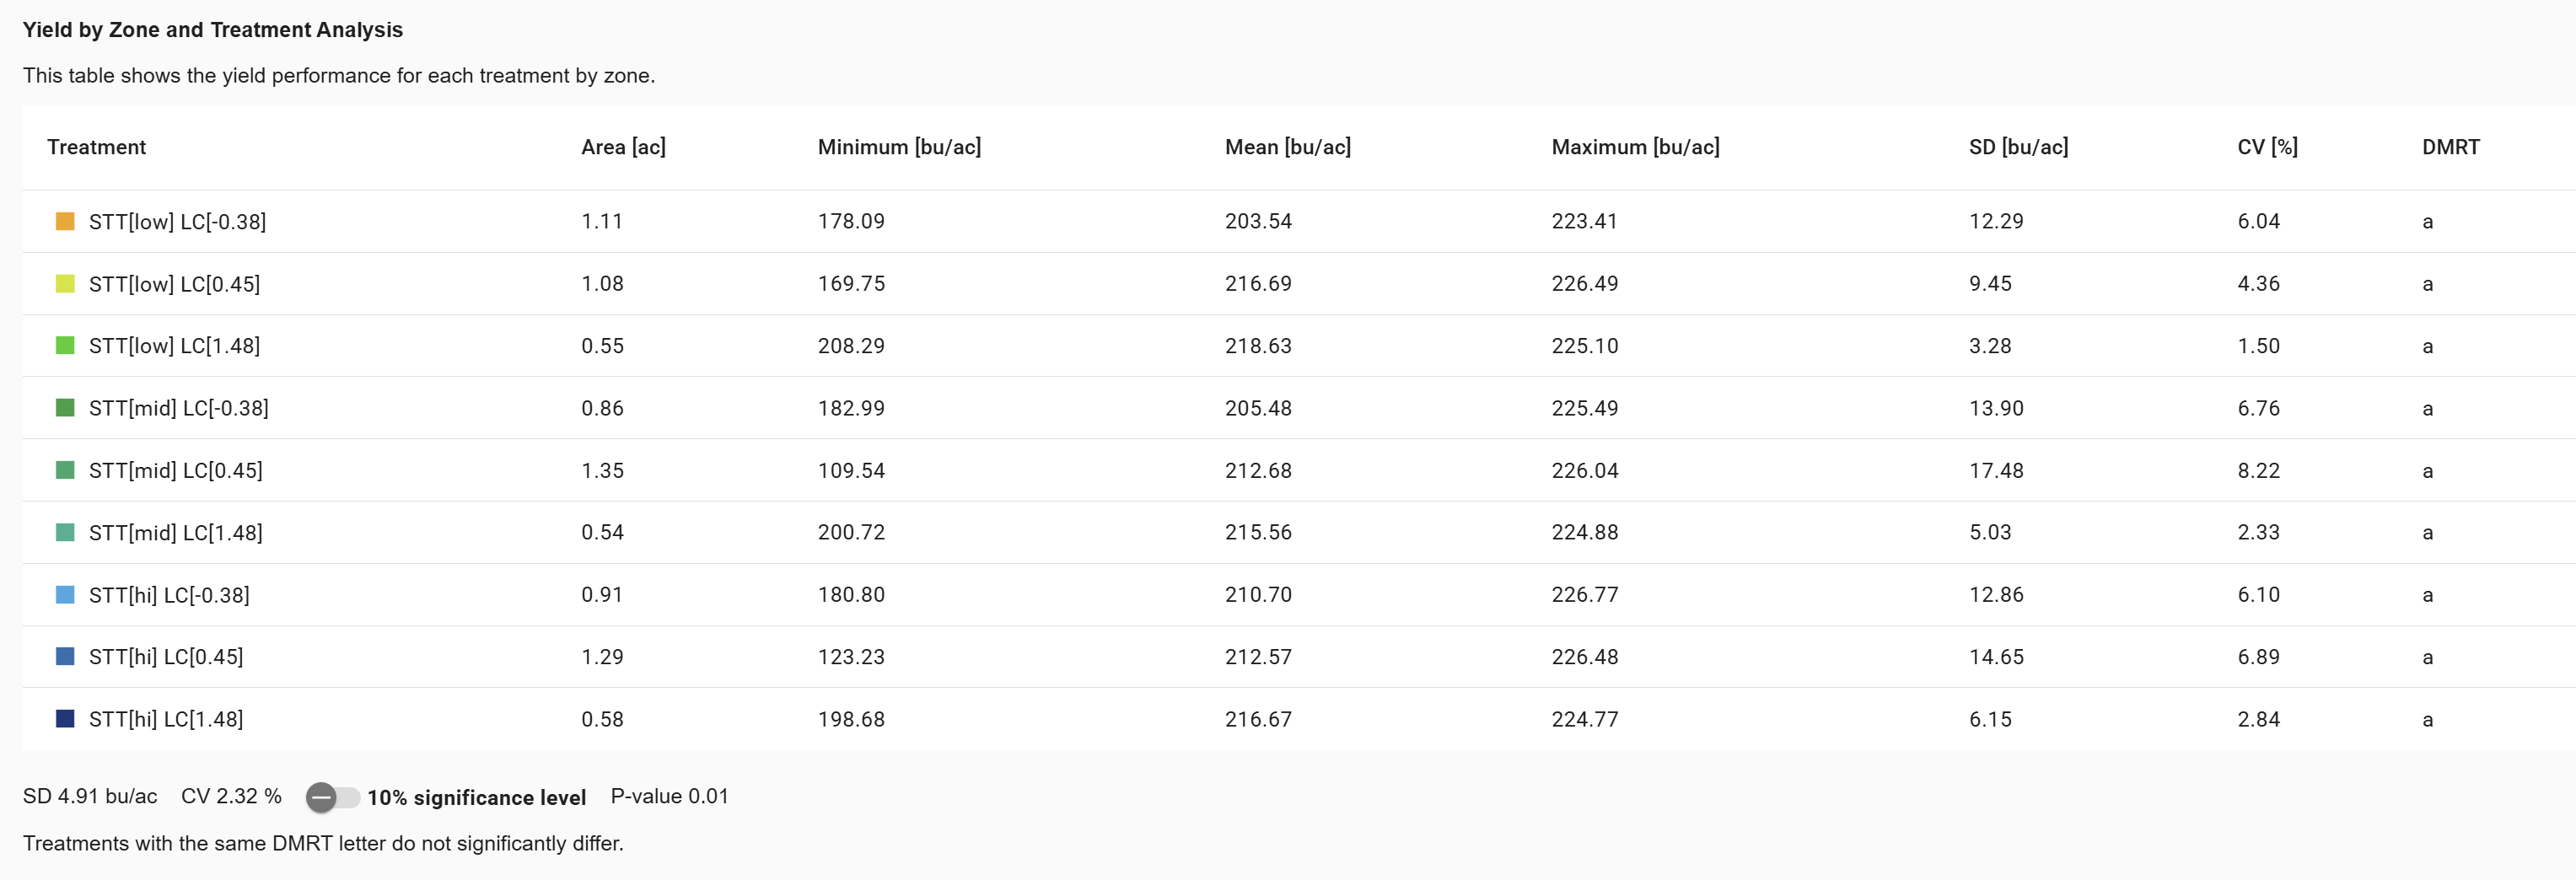
12. A bar graph and table will display the results of the comparison.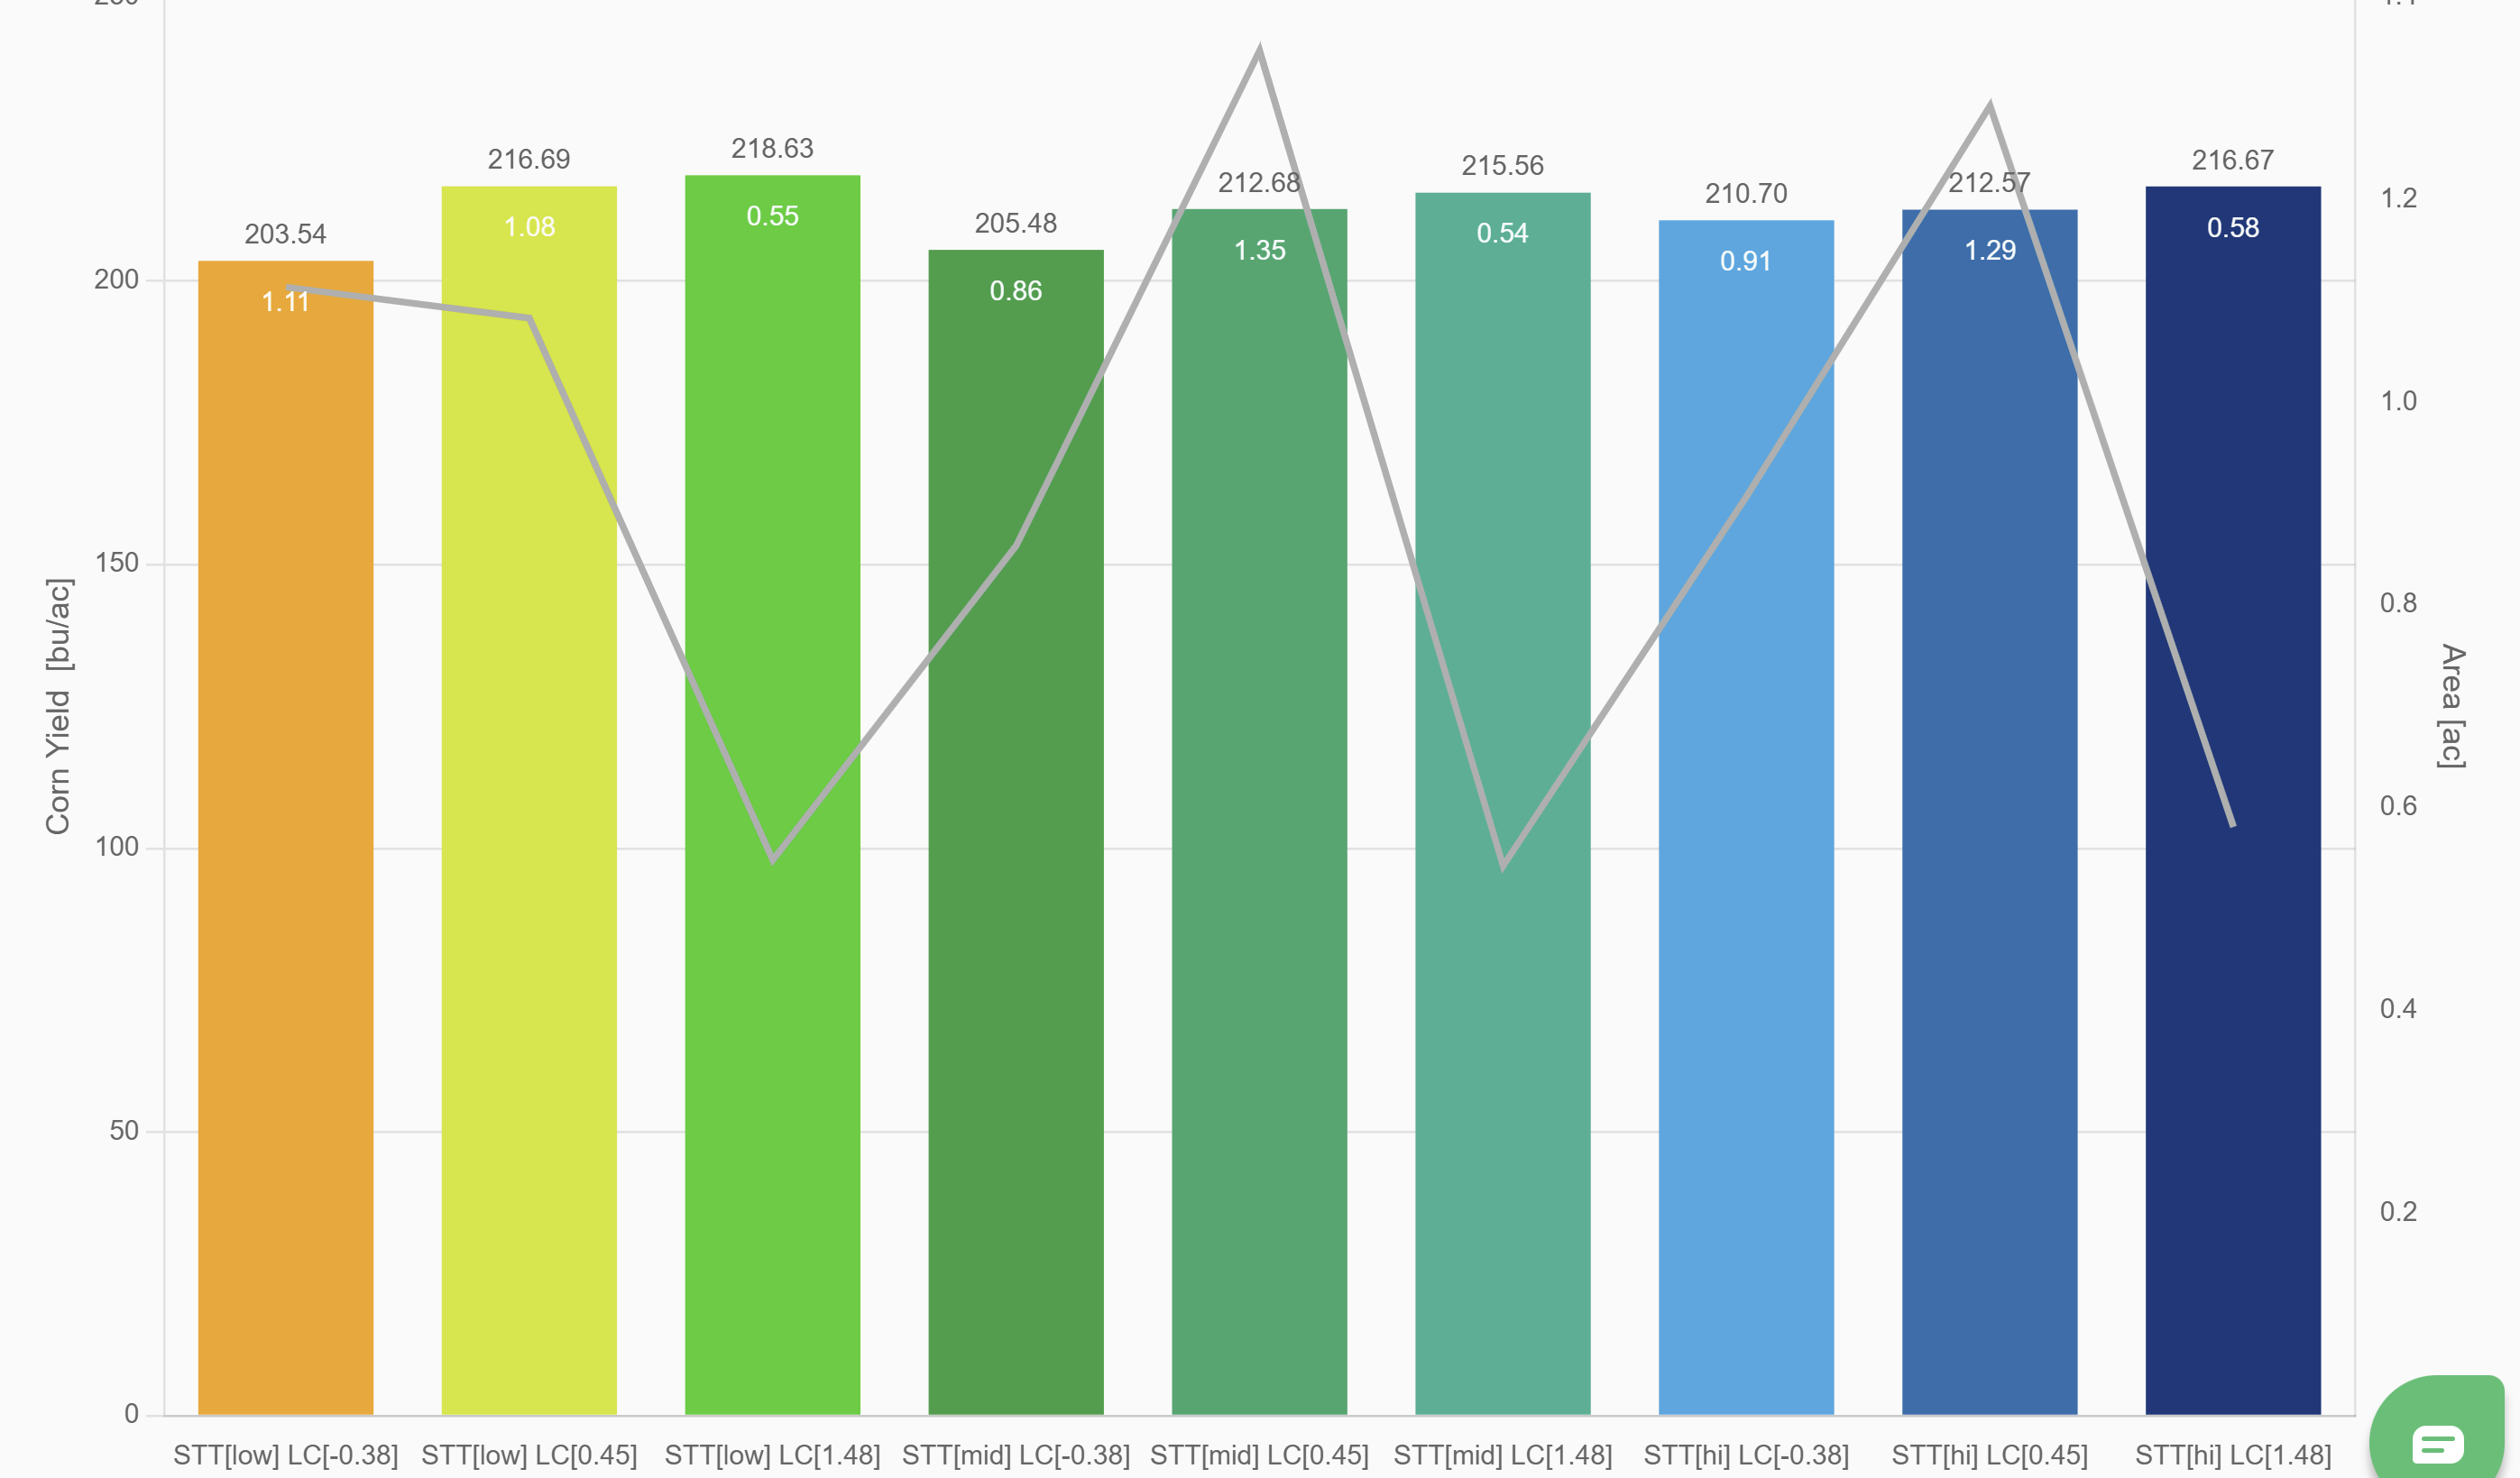
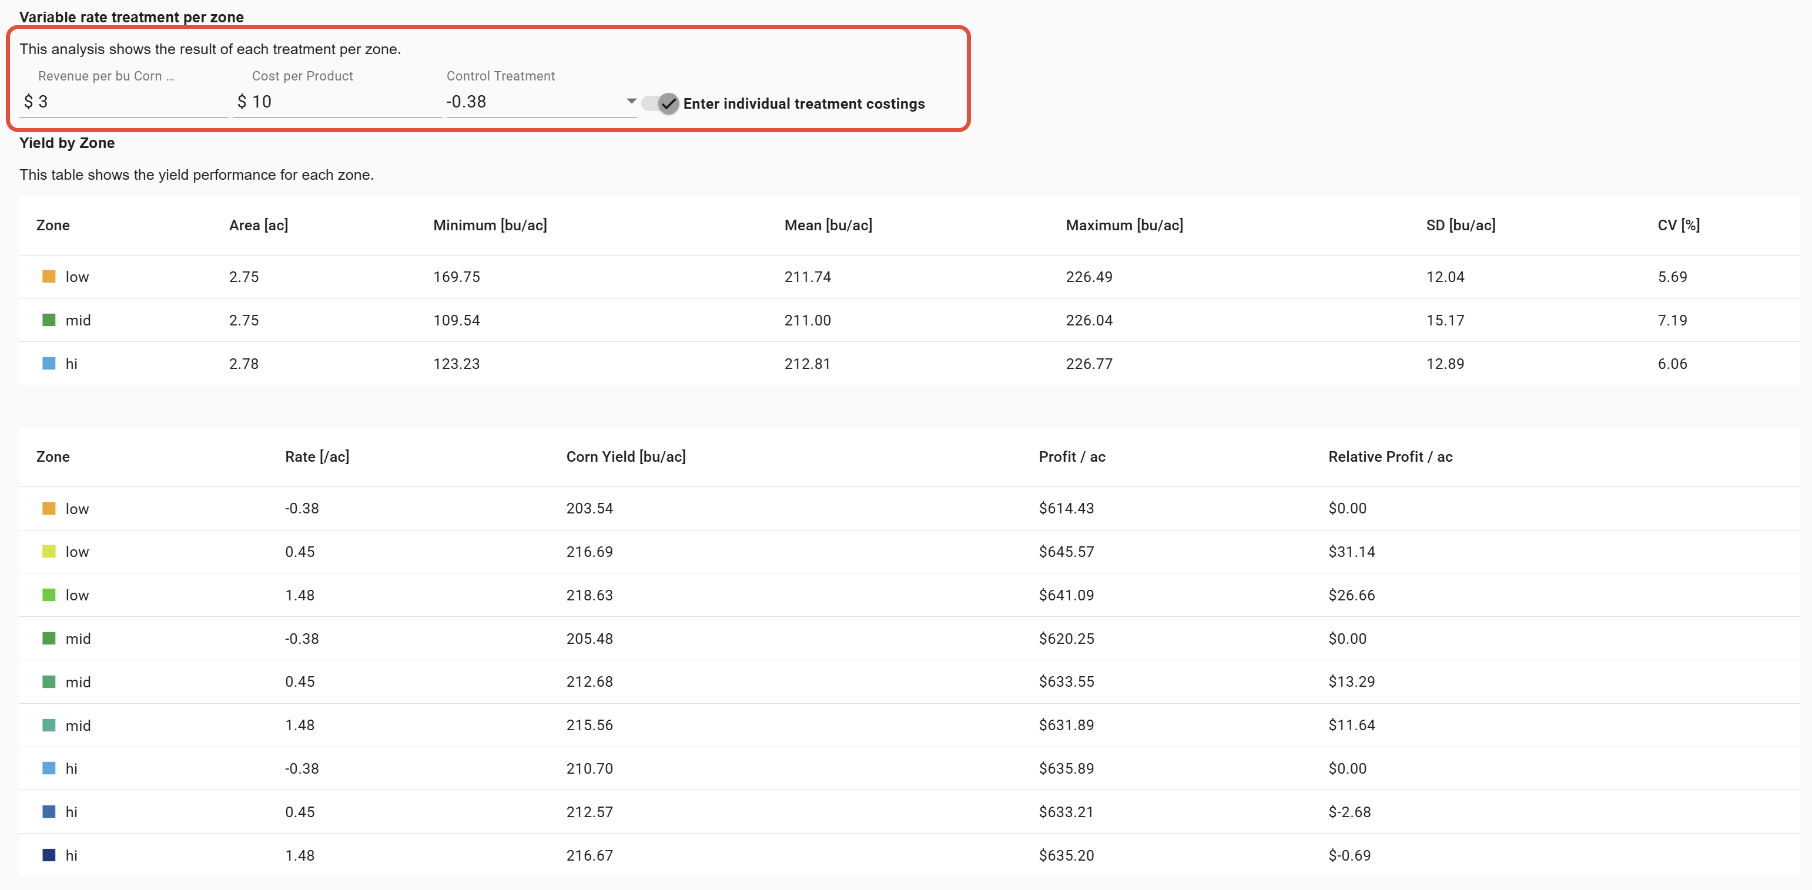
13. Below the graph and table, financial info can be entered. The revenue of the crop can be entered as well as the cost of the product/treatment.
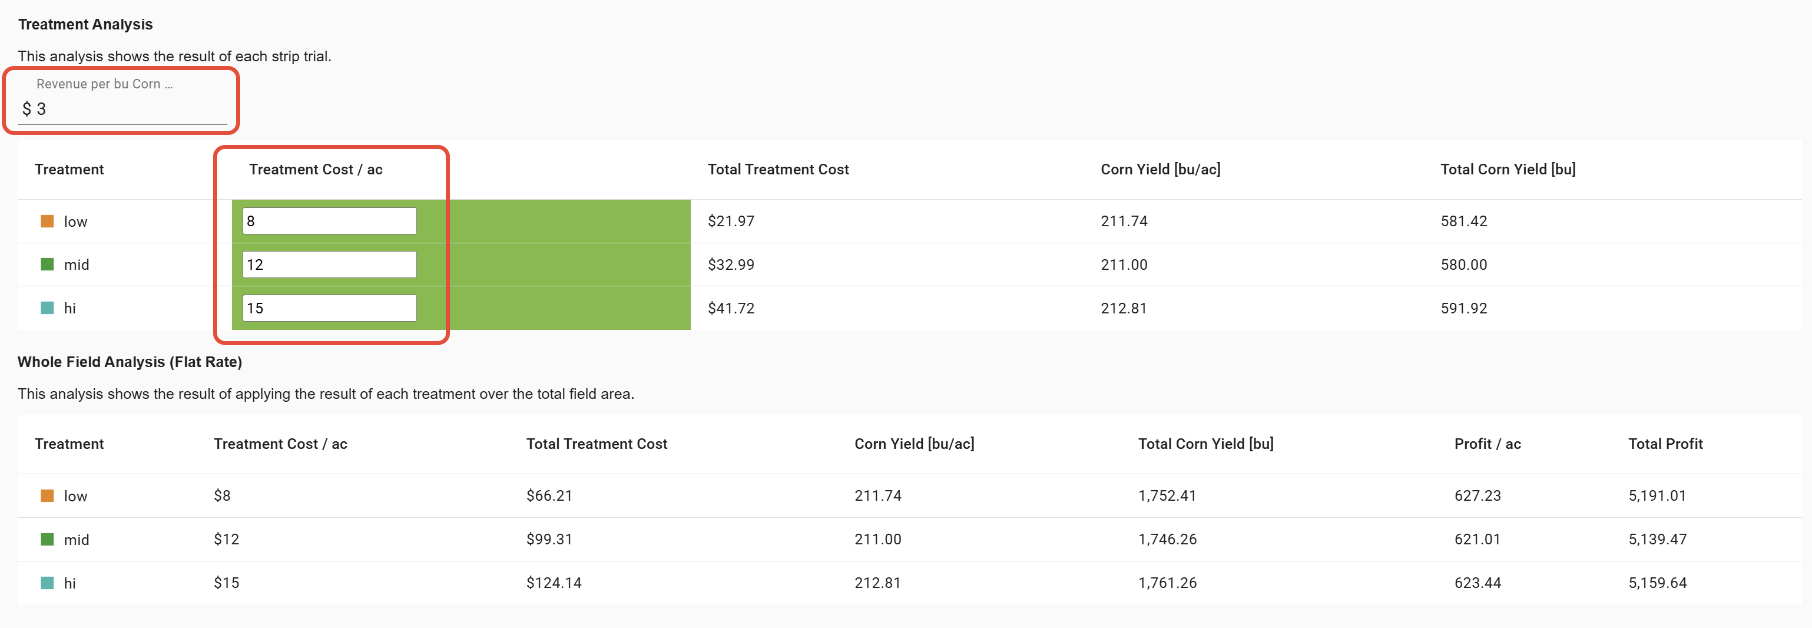
-Note: If a layer was selected in addition to the Strip Trial layer, the values of that layer will be considered the "rate". When the 'Cost per product' is entered, the rates for each zone will be taken into account. In this case, a Control Treatment can be selected as well.
14. To save the analysis in a report, select a Product and click 'Print Report'. Check the 'Save layer' box to save a Rx Trial layer that can be revisited in the future (the Planned Application Date will be the date that the layer is saved under).
Was this article helpful?
That’s Great!
Thank you for your feedback
Sorry! We couldn't be helpful
Thank you for your feedback
Feedback sent
We appreciate your effort and will try to fix the article